
Prometheus-grade observability
for IBM AIX, finally.
The native Prometheus stack for IBM Power — AIX system metrics, errpt logs streamed to Loki, and your PowerVM layer mapped from the HMC. No Linux, no emulation, no workarounds.
The Gap in Your
Monitoring Stack
AIX engineers have always had to work around tools built for Linux. That workaround has a cost.
---------------------------------------------------------------------------
LABEL:           DMPCHK_TOOSMALL
IDENTIFIER:      E87EF18E

Date/Time:       Fri Apr 10 15:00:00 GMT 2026
Sequence Number: 3049342
Machine Id:      ████████████
Node Id:         ████████
Class:           O
Type:            PEND
WPAR:            Global
Resource Name:   dumpcheck

Description
The largest dump device is too small.

Probable Causes
Neither dump device is large enough to accommodate a
system dump at this time.

        Recommended Actions
        Increase the size of one or both dump devices.

Detail Data
Largest dump device
hd7
Largest dump device size in kb
         3145728
Current estimated dump size in kb
         9033277
---------------------------------------------------------------------------
LABEL:           DMPCHK_TOOSMALL
IDENTIFIER:      E87EF18E

Date/Time:       Thu Apr  9 15:00:00 GMT 2026
Sequence Number: 3049341
Machine Id:      ████████████
Node Id:         ████████
Class:           O
Type:            PEND
WPAR:            Global
Resource Name:   dumpcheck

Description
The largest dump device is too small.
DMPCHK_TOOSMALL error, silently logged to errpt for 4 consecutive days on a production LPAR. No alert fired. Nobody noticed.
Non-native tooling, stale data
Existing workarounds rely on tools like Nmon, or exporters requiring Go, Rust, or specific Python versions — none of which run natively on AIX without painful dependency management. And when they do work, data is rarely real-time.
Error logs siloed per LPAR
errpt logs stay trapped on individual LPARs, with no way to correlate events across hardware, sequence, or severity. When something breaks, you're manually piecing together context from multiple systems — slowing root cause analysis when it matters most.
Problems found too late
Without native telemetry, alerting systems can't fire on what they can't measure. Degradation goes undetected for weeks — or months — until users report the symptom. By then, the business impact is already in motion, and you're investigating from a cold trail.
Note from IBM Documentation
IBM's own documentation recommends Prometheus and Node Exporter for Power Systems — but their setup guide targets IBM z16 running RHEL 8.5 only. The pre-compiled binary is for the s390x architecture. It does not run on AIX.
AIXWatch AIX-exporter fills that gap — the only native Prometheus exporter compiled for IBM AIX on POWER hardware. No Linux required, no sidecar, no SNMP bridge. Install via BFF/installp and start scraping metrics in under 5 minutes.
Three exporters.
One Power stack.
AIXWatch is a modular family of native exporters for IBM Power. Adopt one, add the rest as you grow — every piece feeds the same Prometheus & Grafana stack you already run.
AIX-exporter
The only native Prometheus exporter for AIX. CPU, memory, disk, FC, network, NFS and errpt — straight off the LPAR, no sidecar.
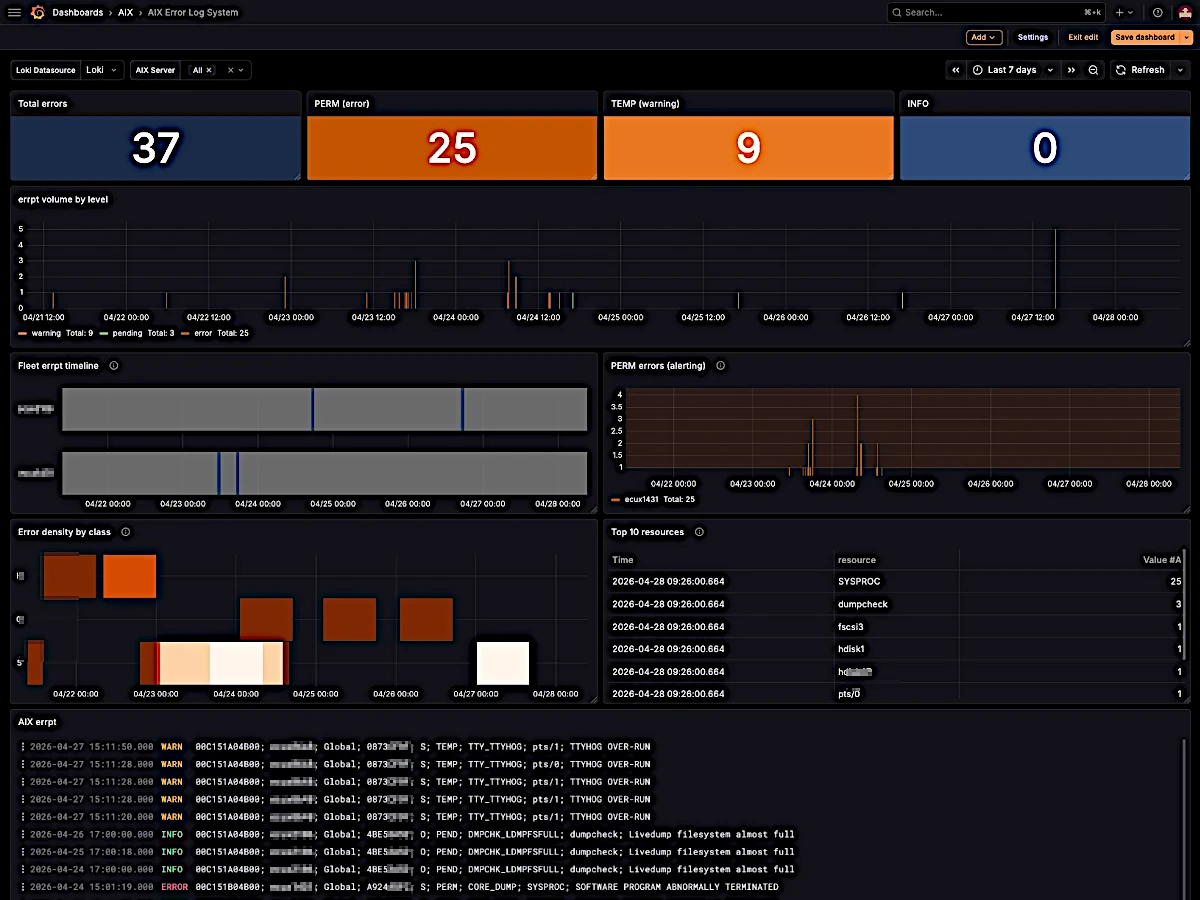
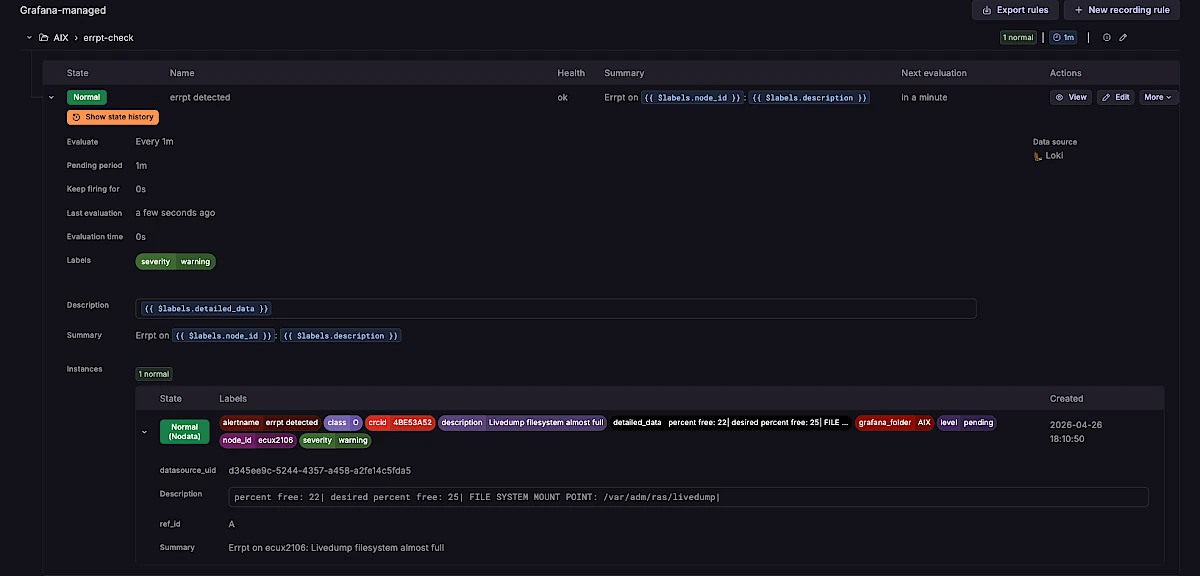
Loki Agent
Stream errpt from every LPAR to Grafana Loki in real time, with 9 structured labels for instant cross-fleet correlation.
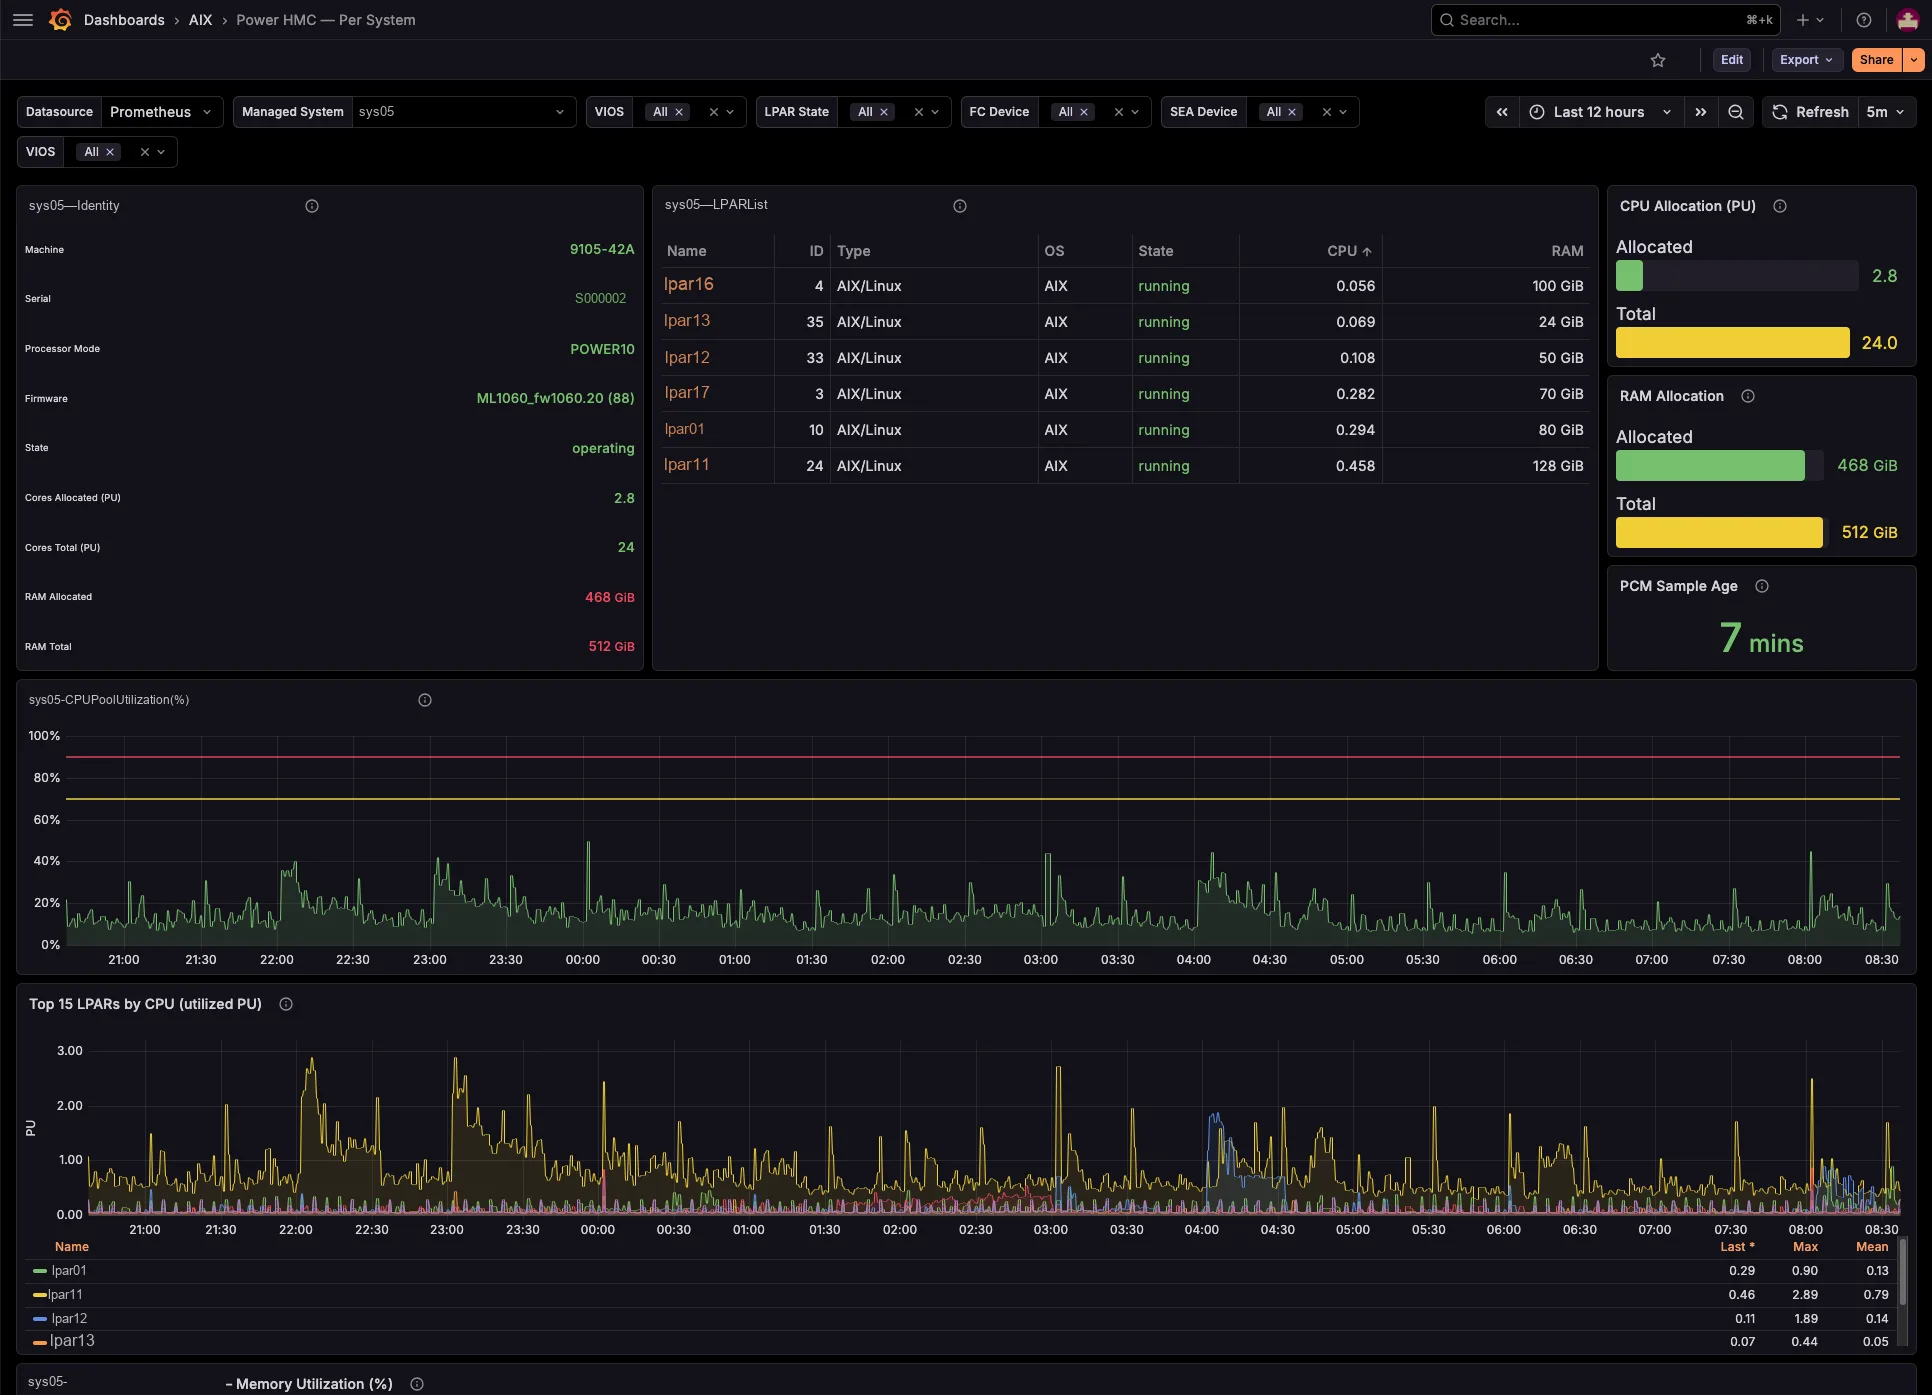
power-hmc-exporter
Map the whole virtualization layer from the HMC — shared pools, LPAR↔VIOS, SEA / NPIV / VSCSI — agentless, with labels pre-resolved.
The AIXwatch Suite puts all three exporters on one annual subscription — volume pricing from €120 down to €60 per LPAR / year. The more LPARs you run, the less you pay.
Explore the Suite →From download to first metric in 5 minutes
Designed by AIX engineers, for AIX engineers. No workarounds, no emulation — just native telemetry that works.
Install
Download the BFF package and run installp on your LPARs. Active and scraping metrics in 2 minutes — no reboots, no kernel modules.
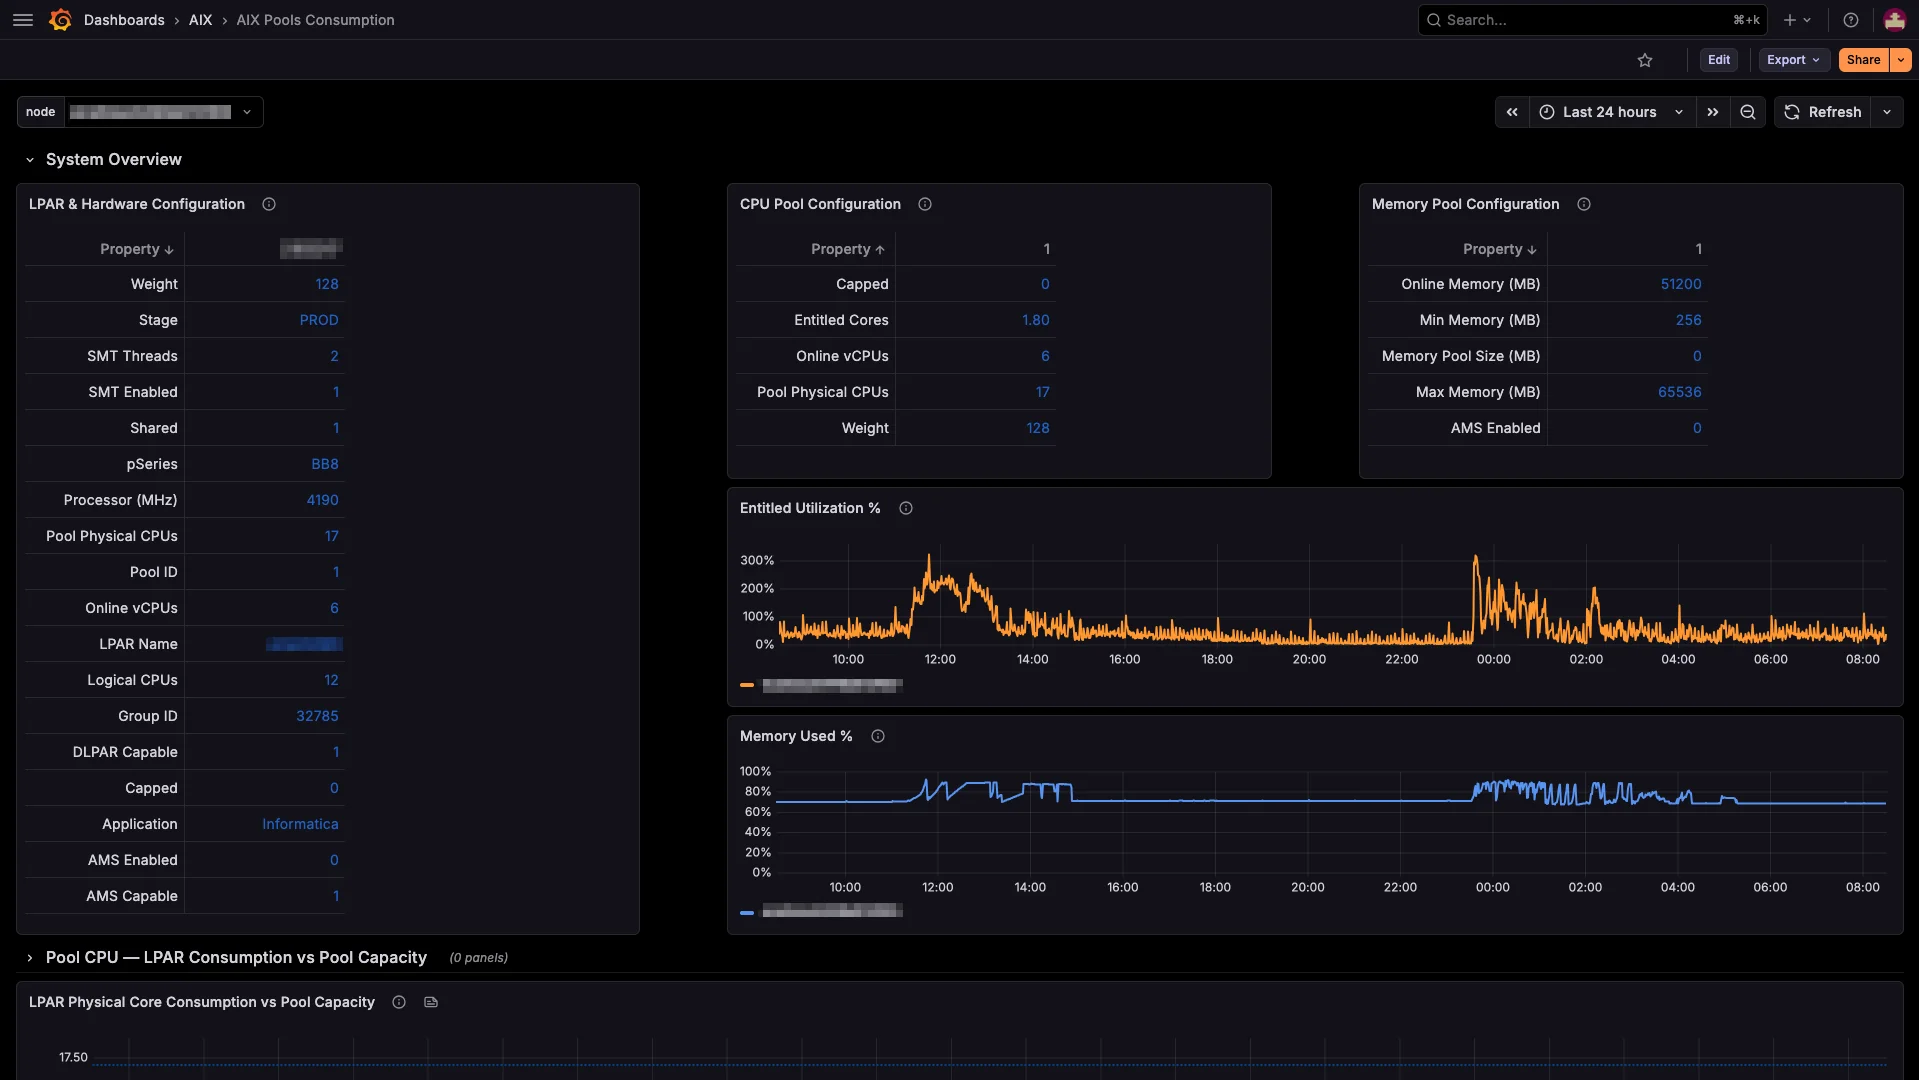
Configure
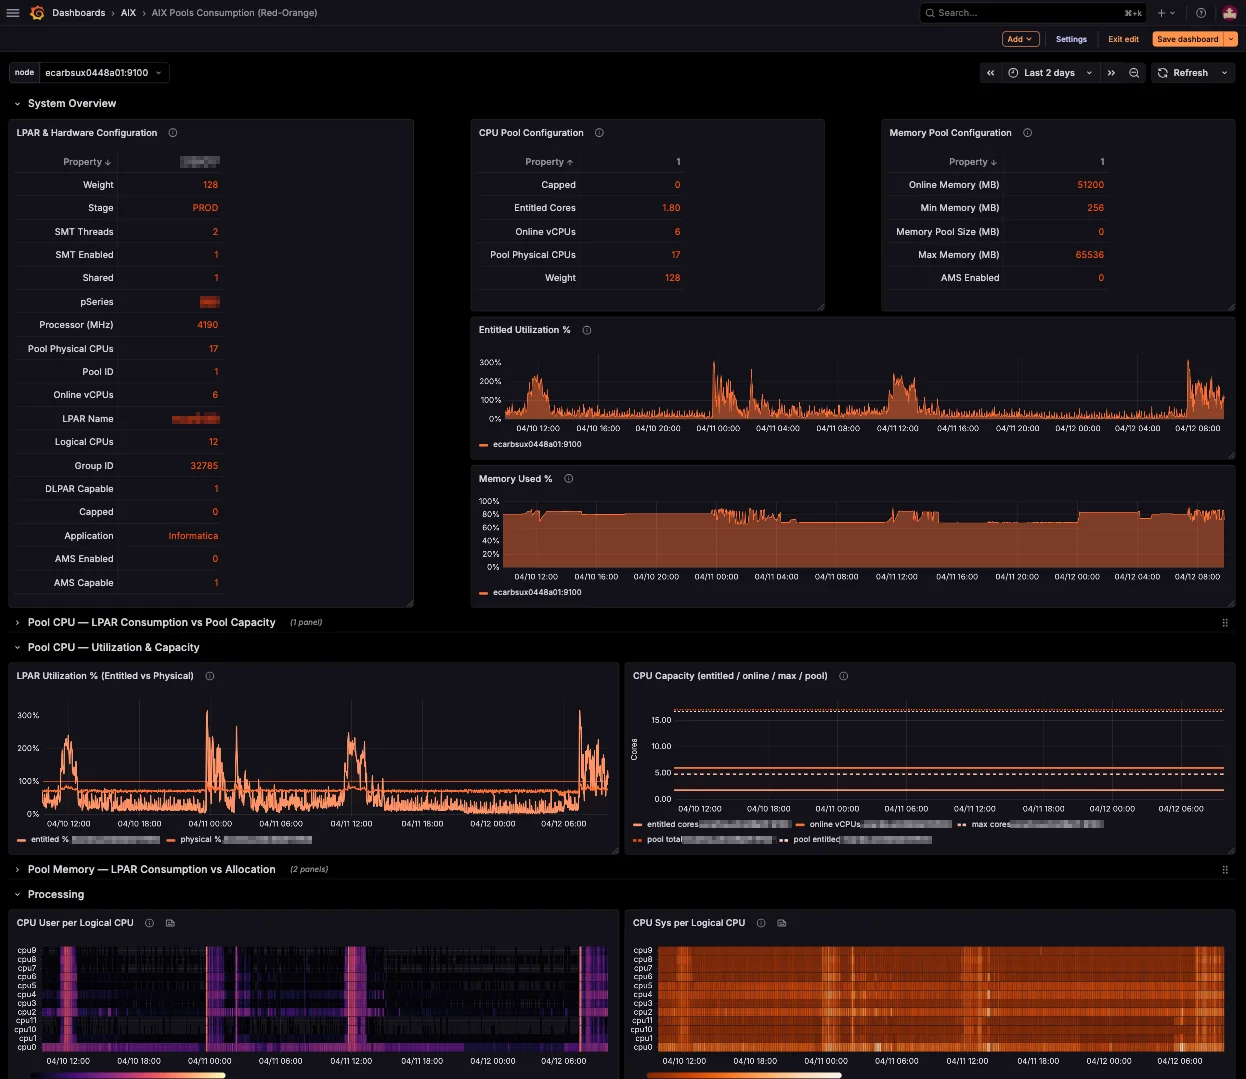
Point your existing Prometheus instance at your LPARs. Import the included Grafana dashboard — 22 pre-built panels, zero setup time.
Monitor
Build alerting rules on any metric that matters — CPU, memory, disks, errpt events, and hundreds more. Get notified where your team already works — Slack, Microsoft Teams, ServiceNow, PagerDuty, Telegram, email, or any webhook endpoint.
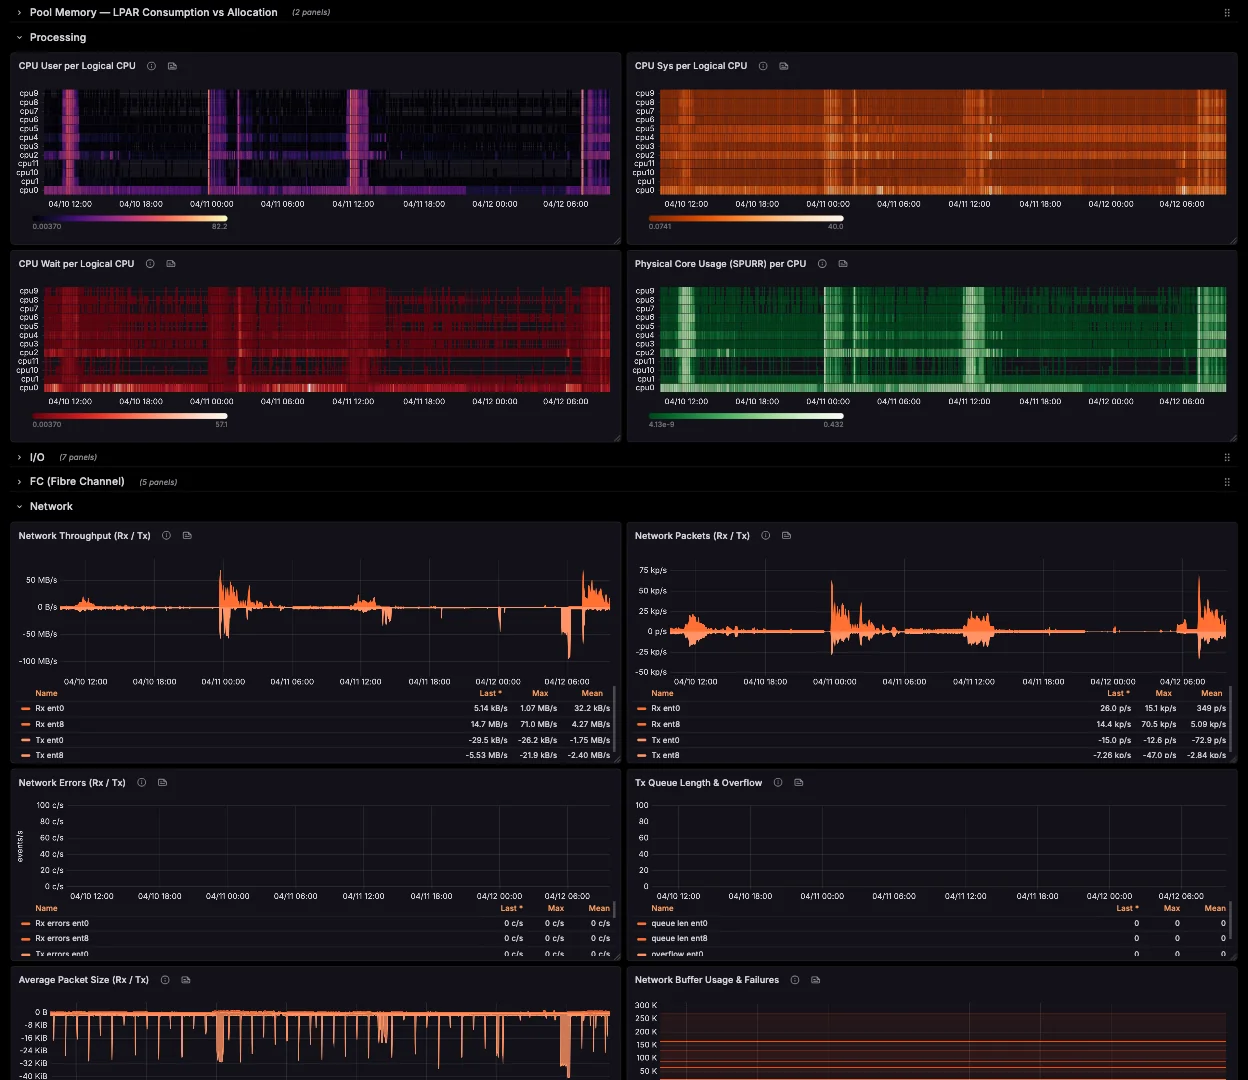
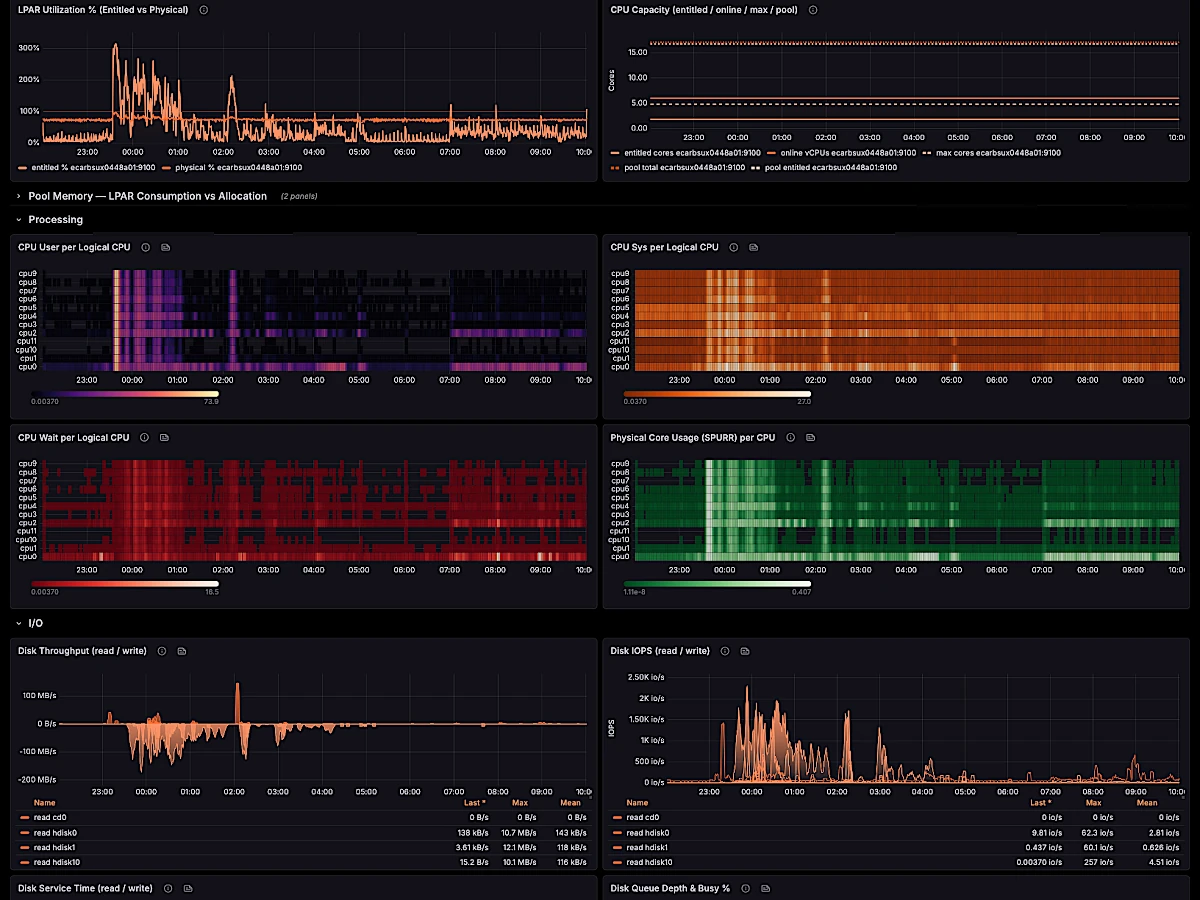
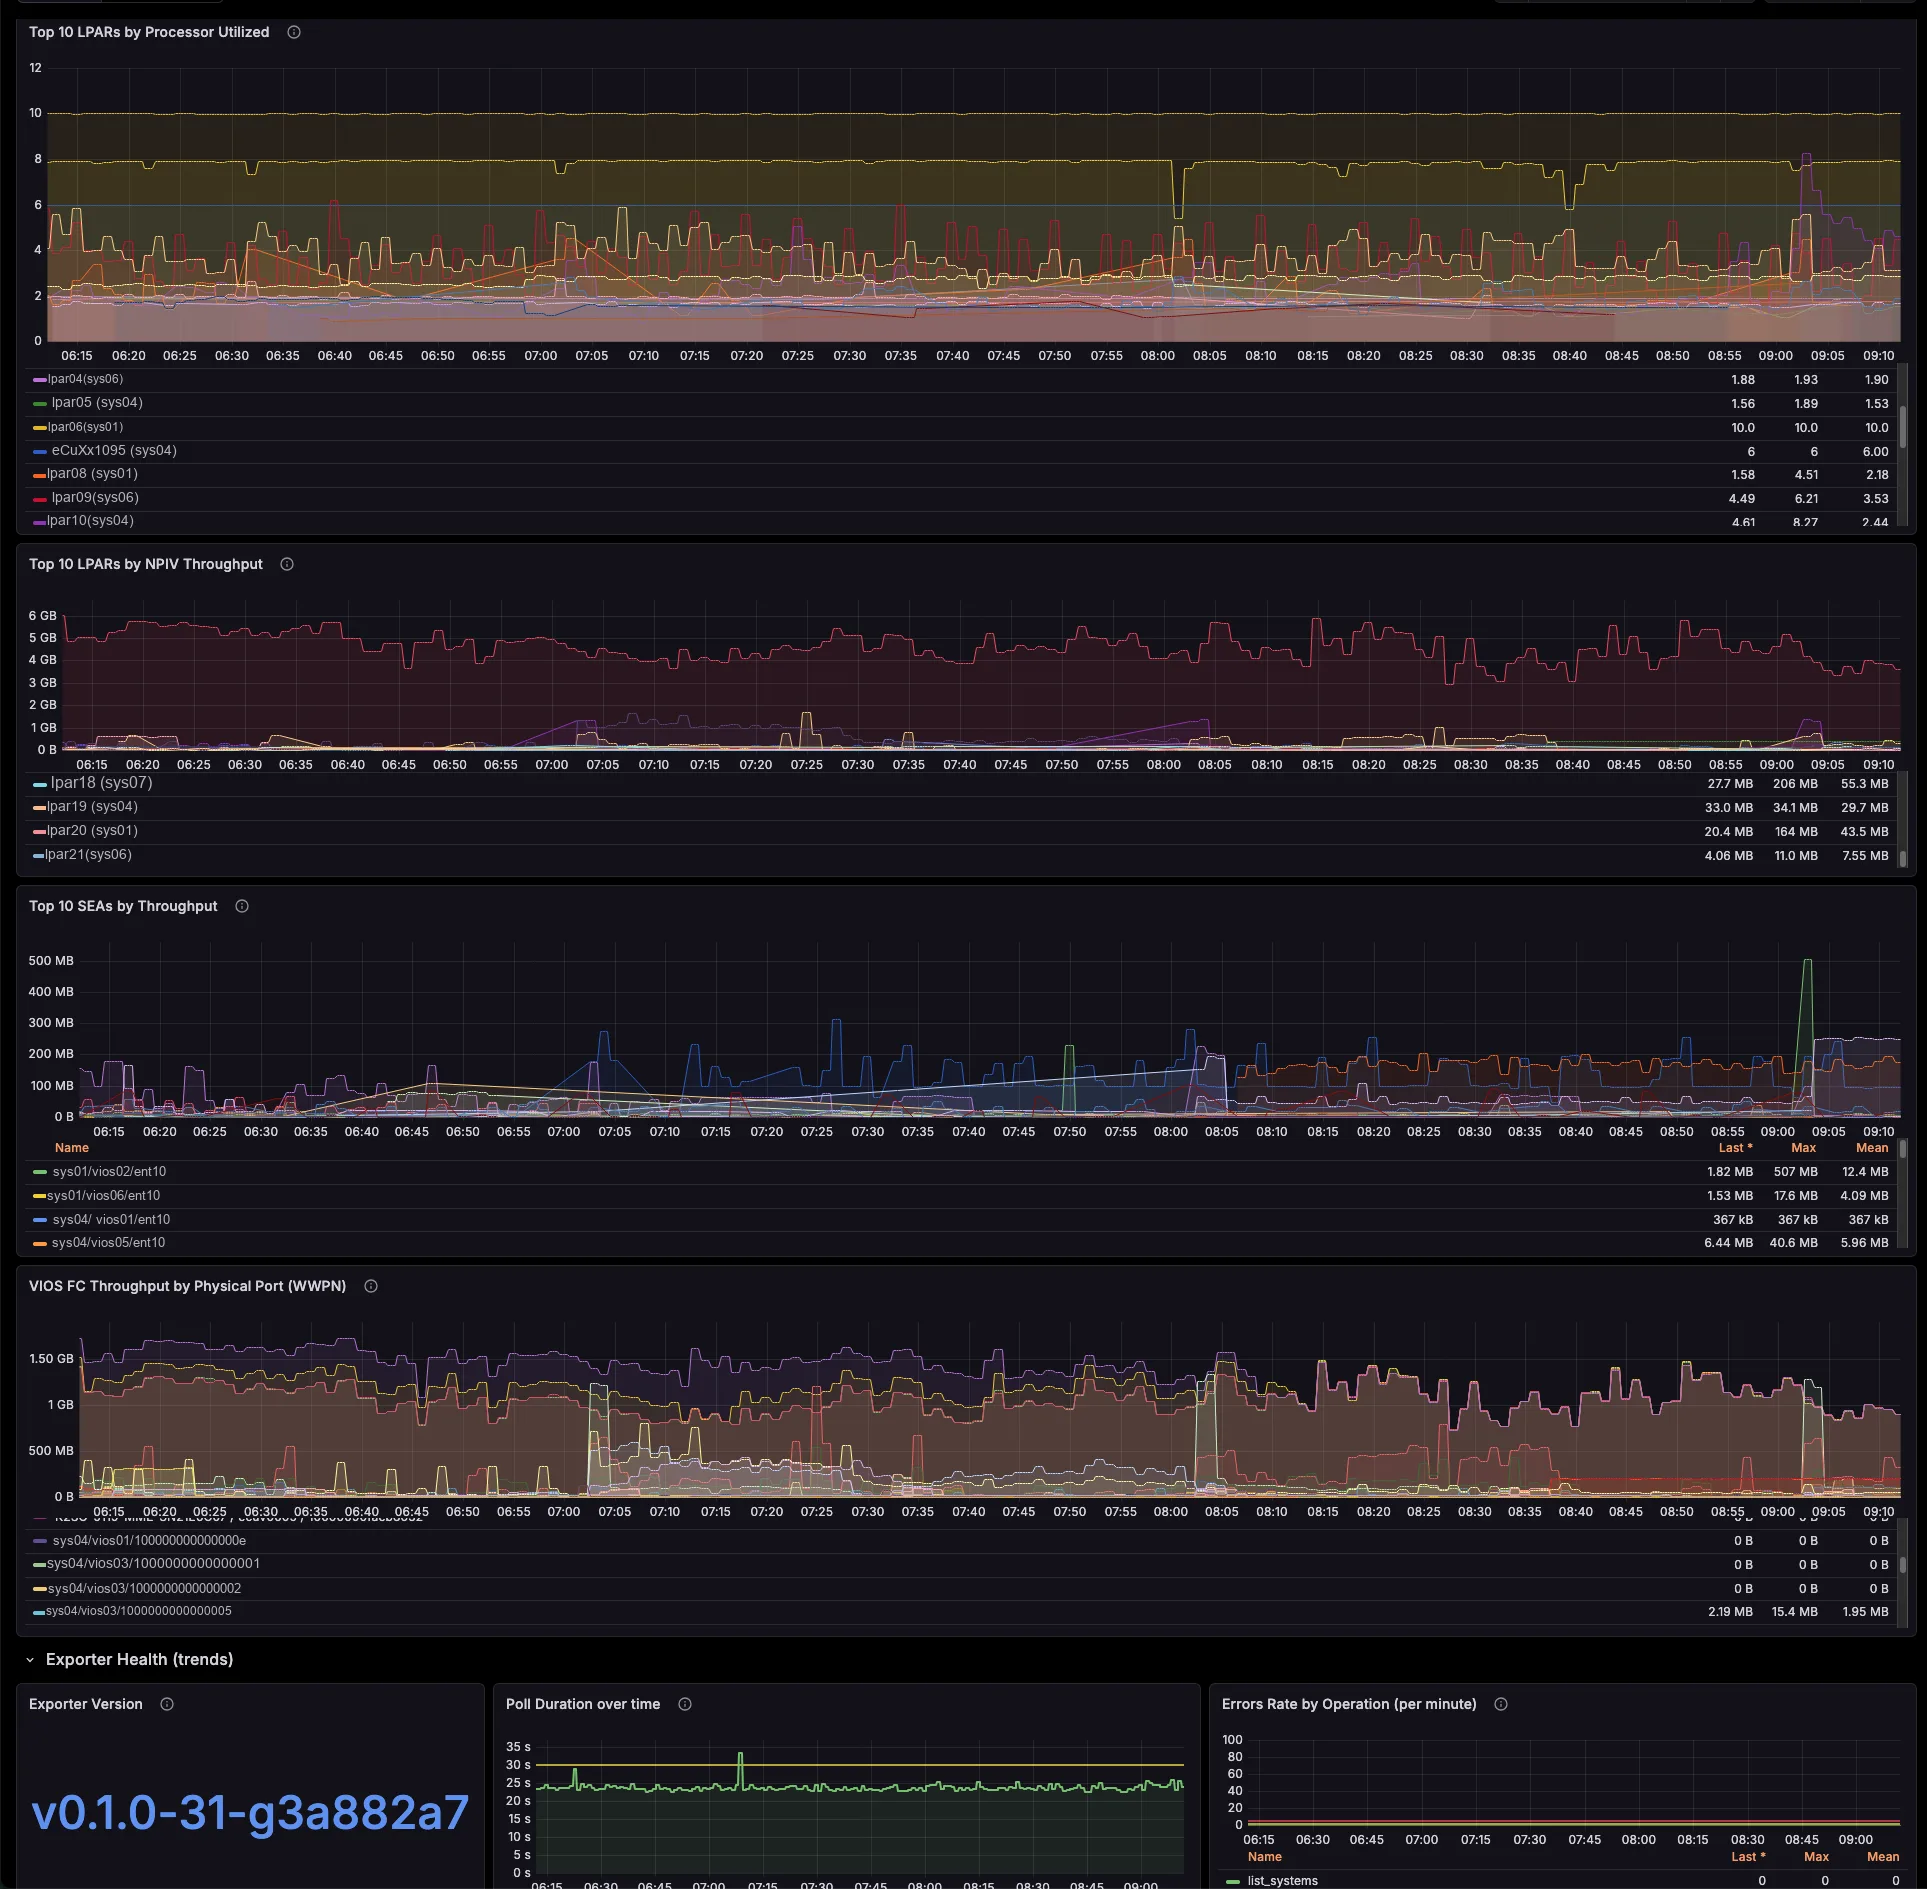
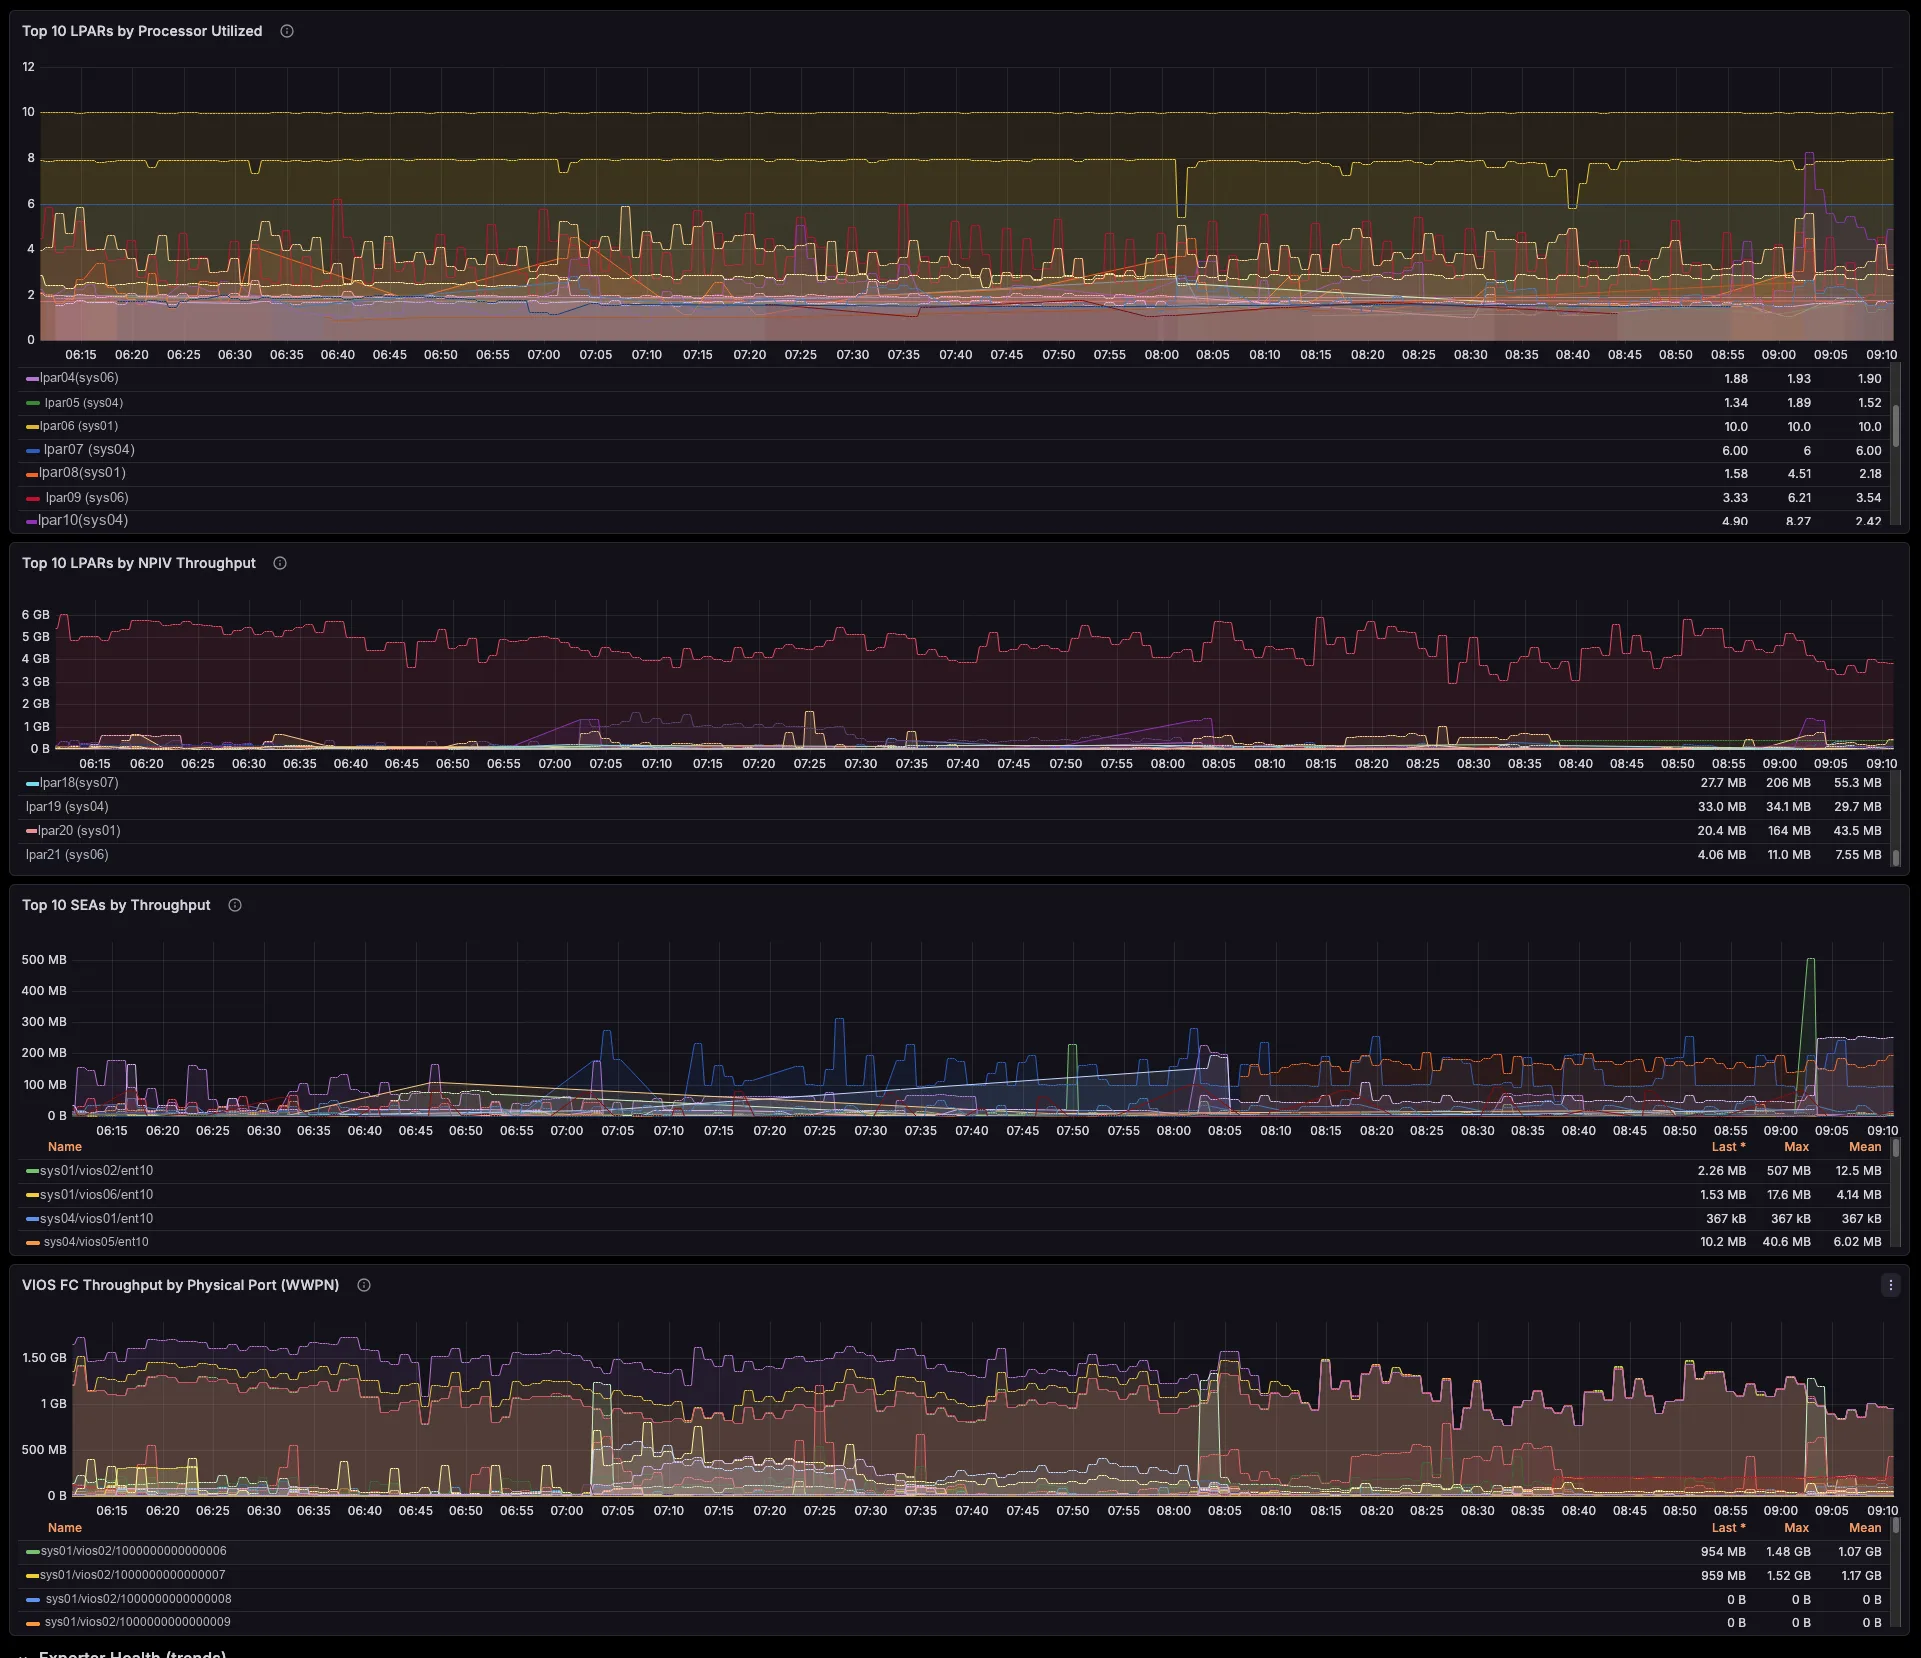
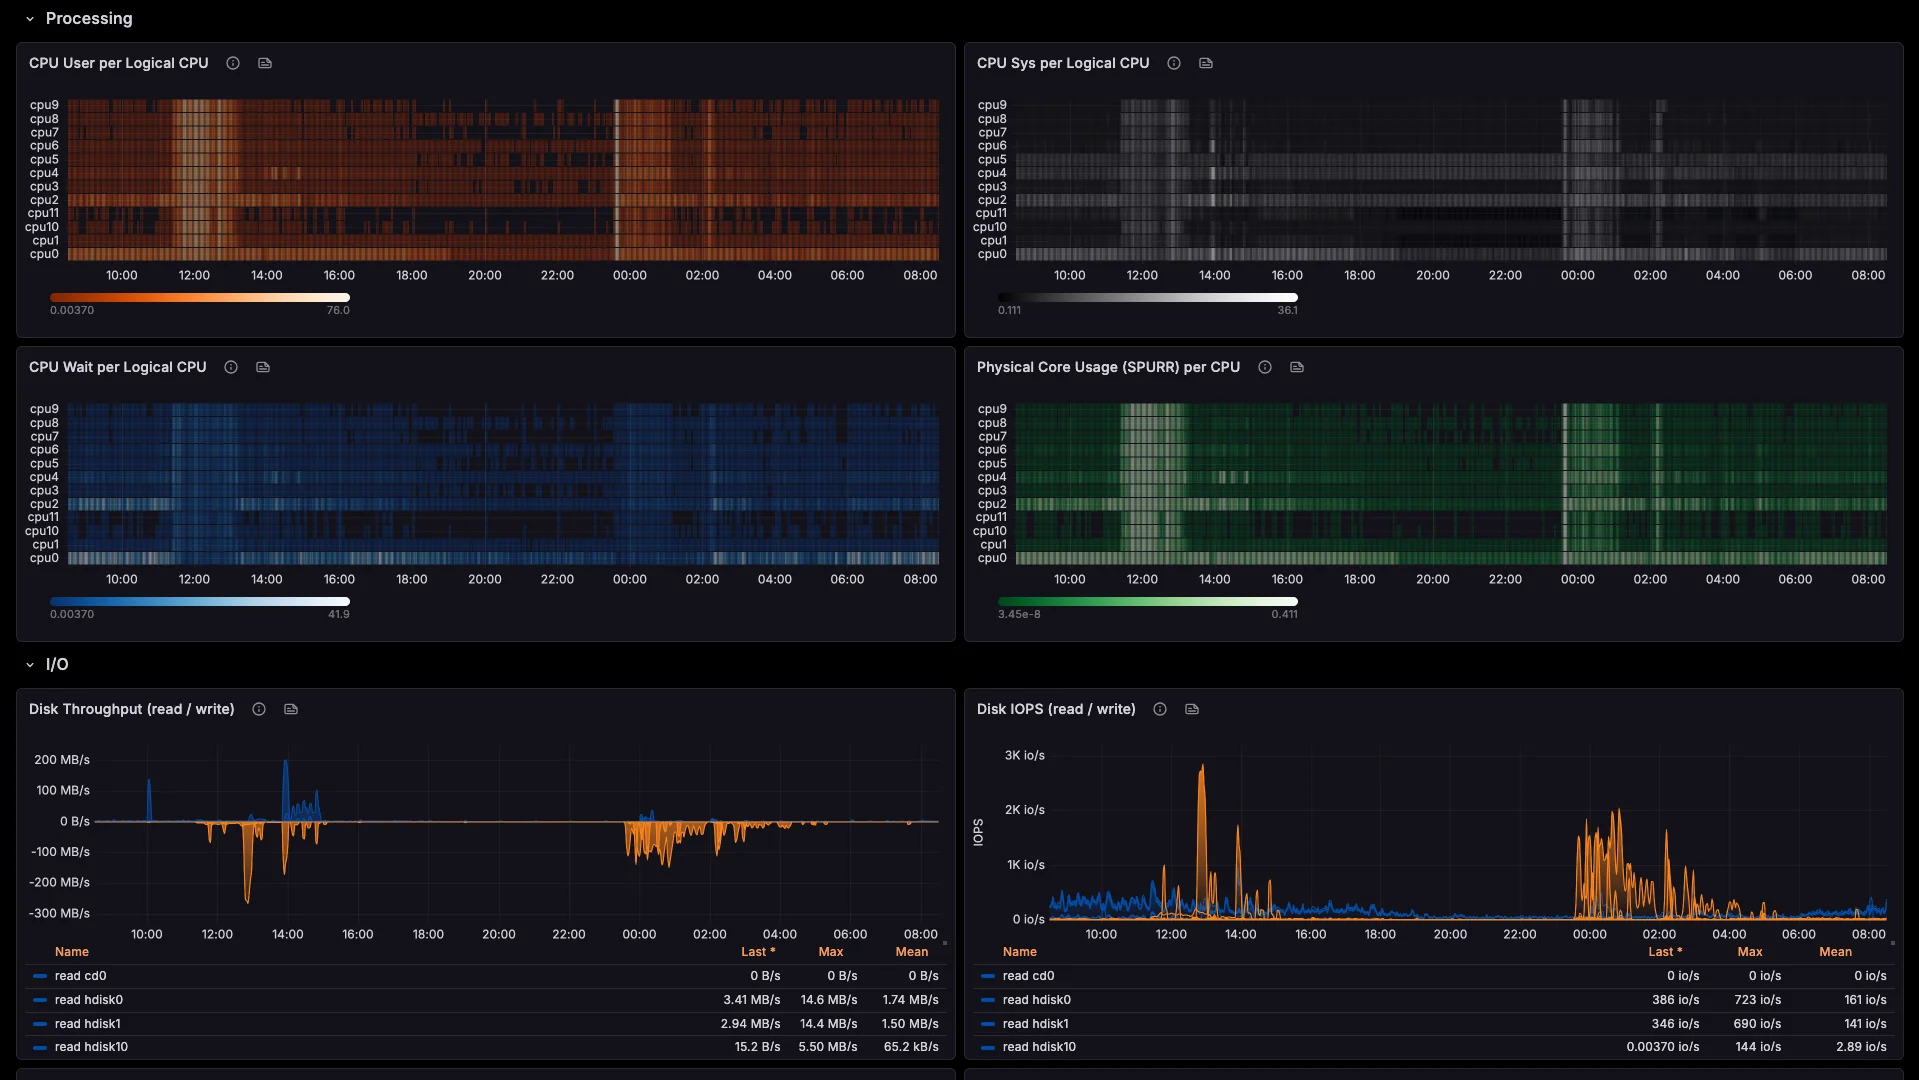
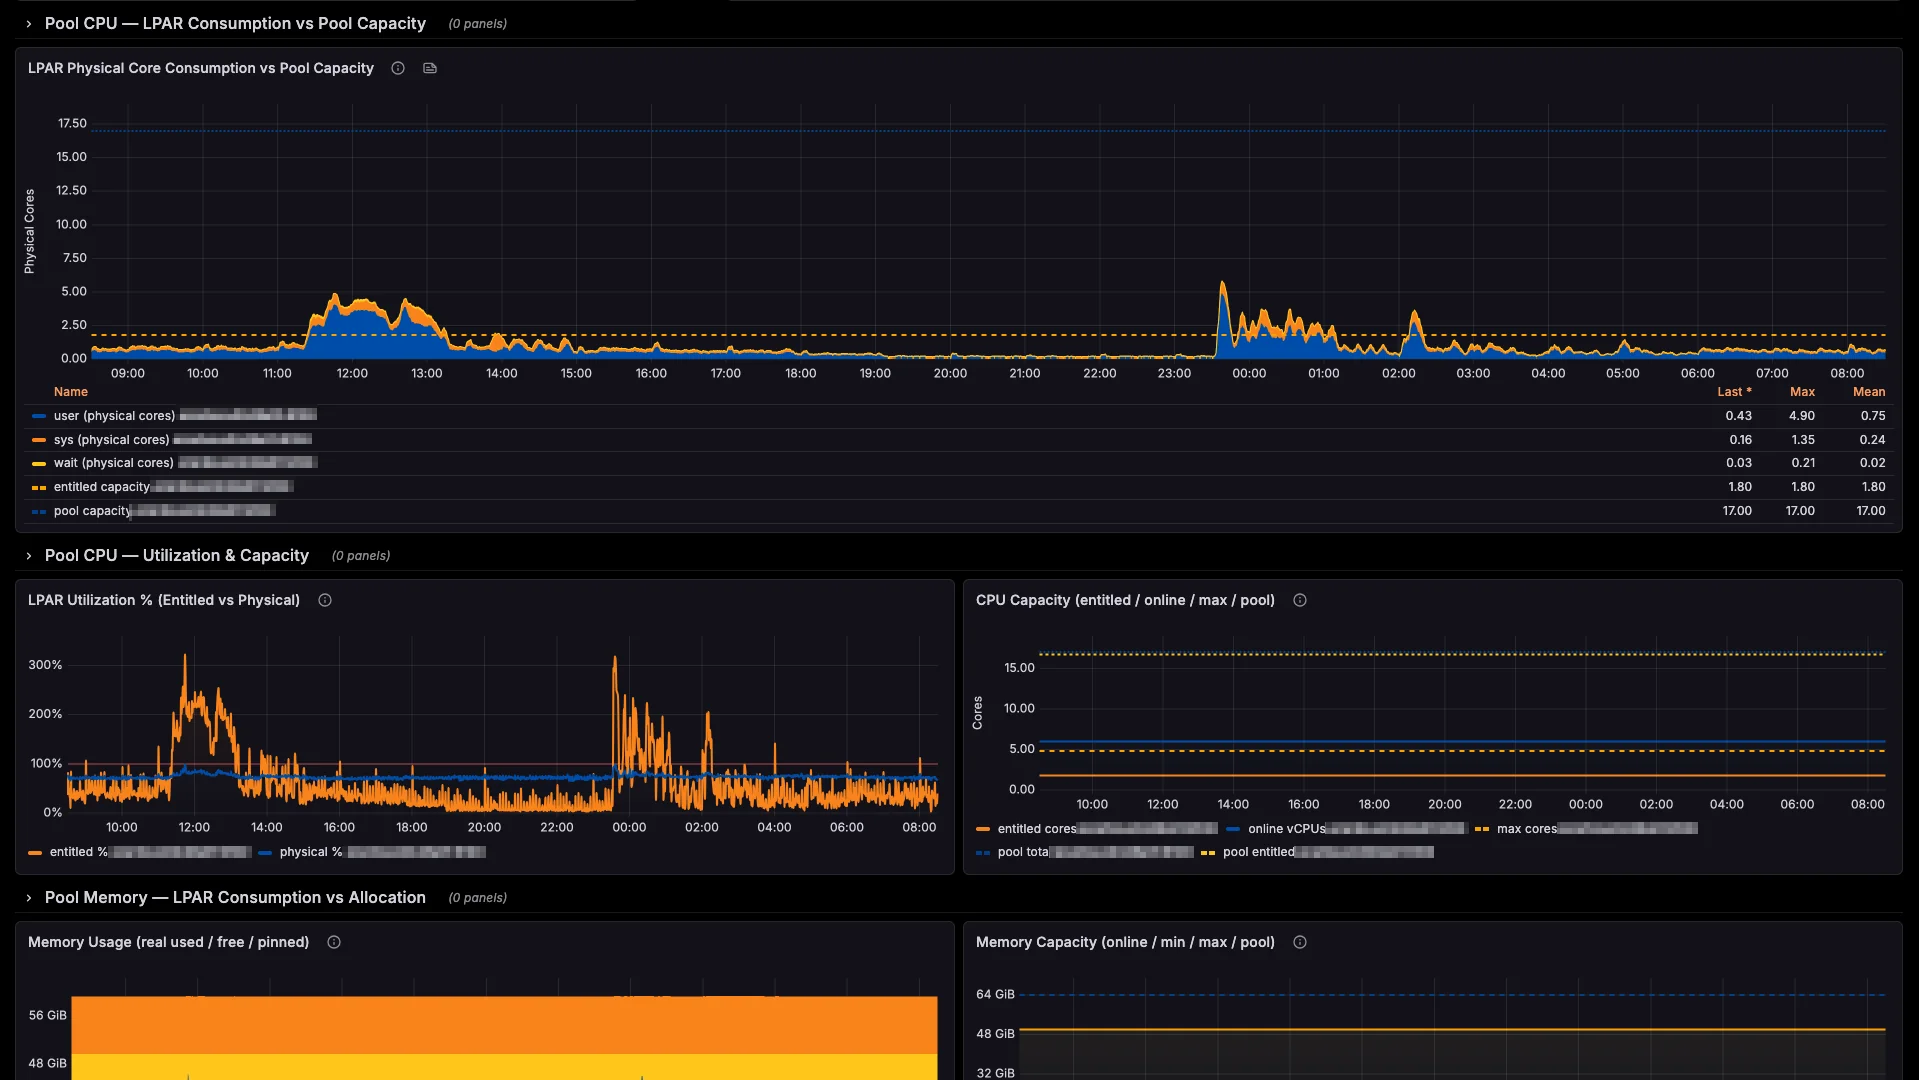
Every metric. Every LPAR.
One dashboard.
Real-time visibility across your entire POWER fleet, in the tools your team already uses.
Blind spots don't stay small
A real-world cascade: how one errpt entry becomes a production incident.
DMPCHK_TOOSMALL logged to errpt
The dump device can no longer accommodate a system crash dump. errpt dutifully records it. No alert fires. No engineer notices — because no tool is watching errpt across LPARs.
LatentSame entry, same time, same silence
The warning repeats itself on schedule. errpt is still siloed on that single LPAR. No correlation across hardware, no pattern detection. The issue grows in the dark through the weekend.
LatentKernel panic on the production LPAR
An unrelated hardware event crashes the system. The kernel tries to write a crash dump to the undersized device — and fails. No dump. No memory snapshot. No root-cause data. The LPAR is down, and you're flying blind into the investigation.
Active incidentYou're paged by users, not by tools
Business apps have been down for hours. Angry tickets escalate to management. Without dump data, your team spends the morning reconstructing the event from partial logs, SAN traces, and guesswork.
Business impactProduction restored — six hours later
SLA breached. The post-mortem reveals errpt had been warning for four consecutive days. The fix would have taken five minutes on Wednesday. It cost six hours of downtime on Monday.
Business impact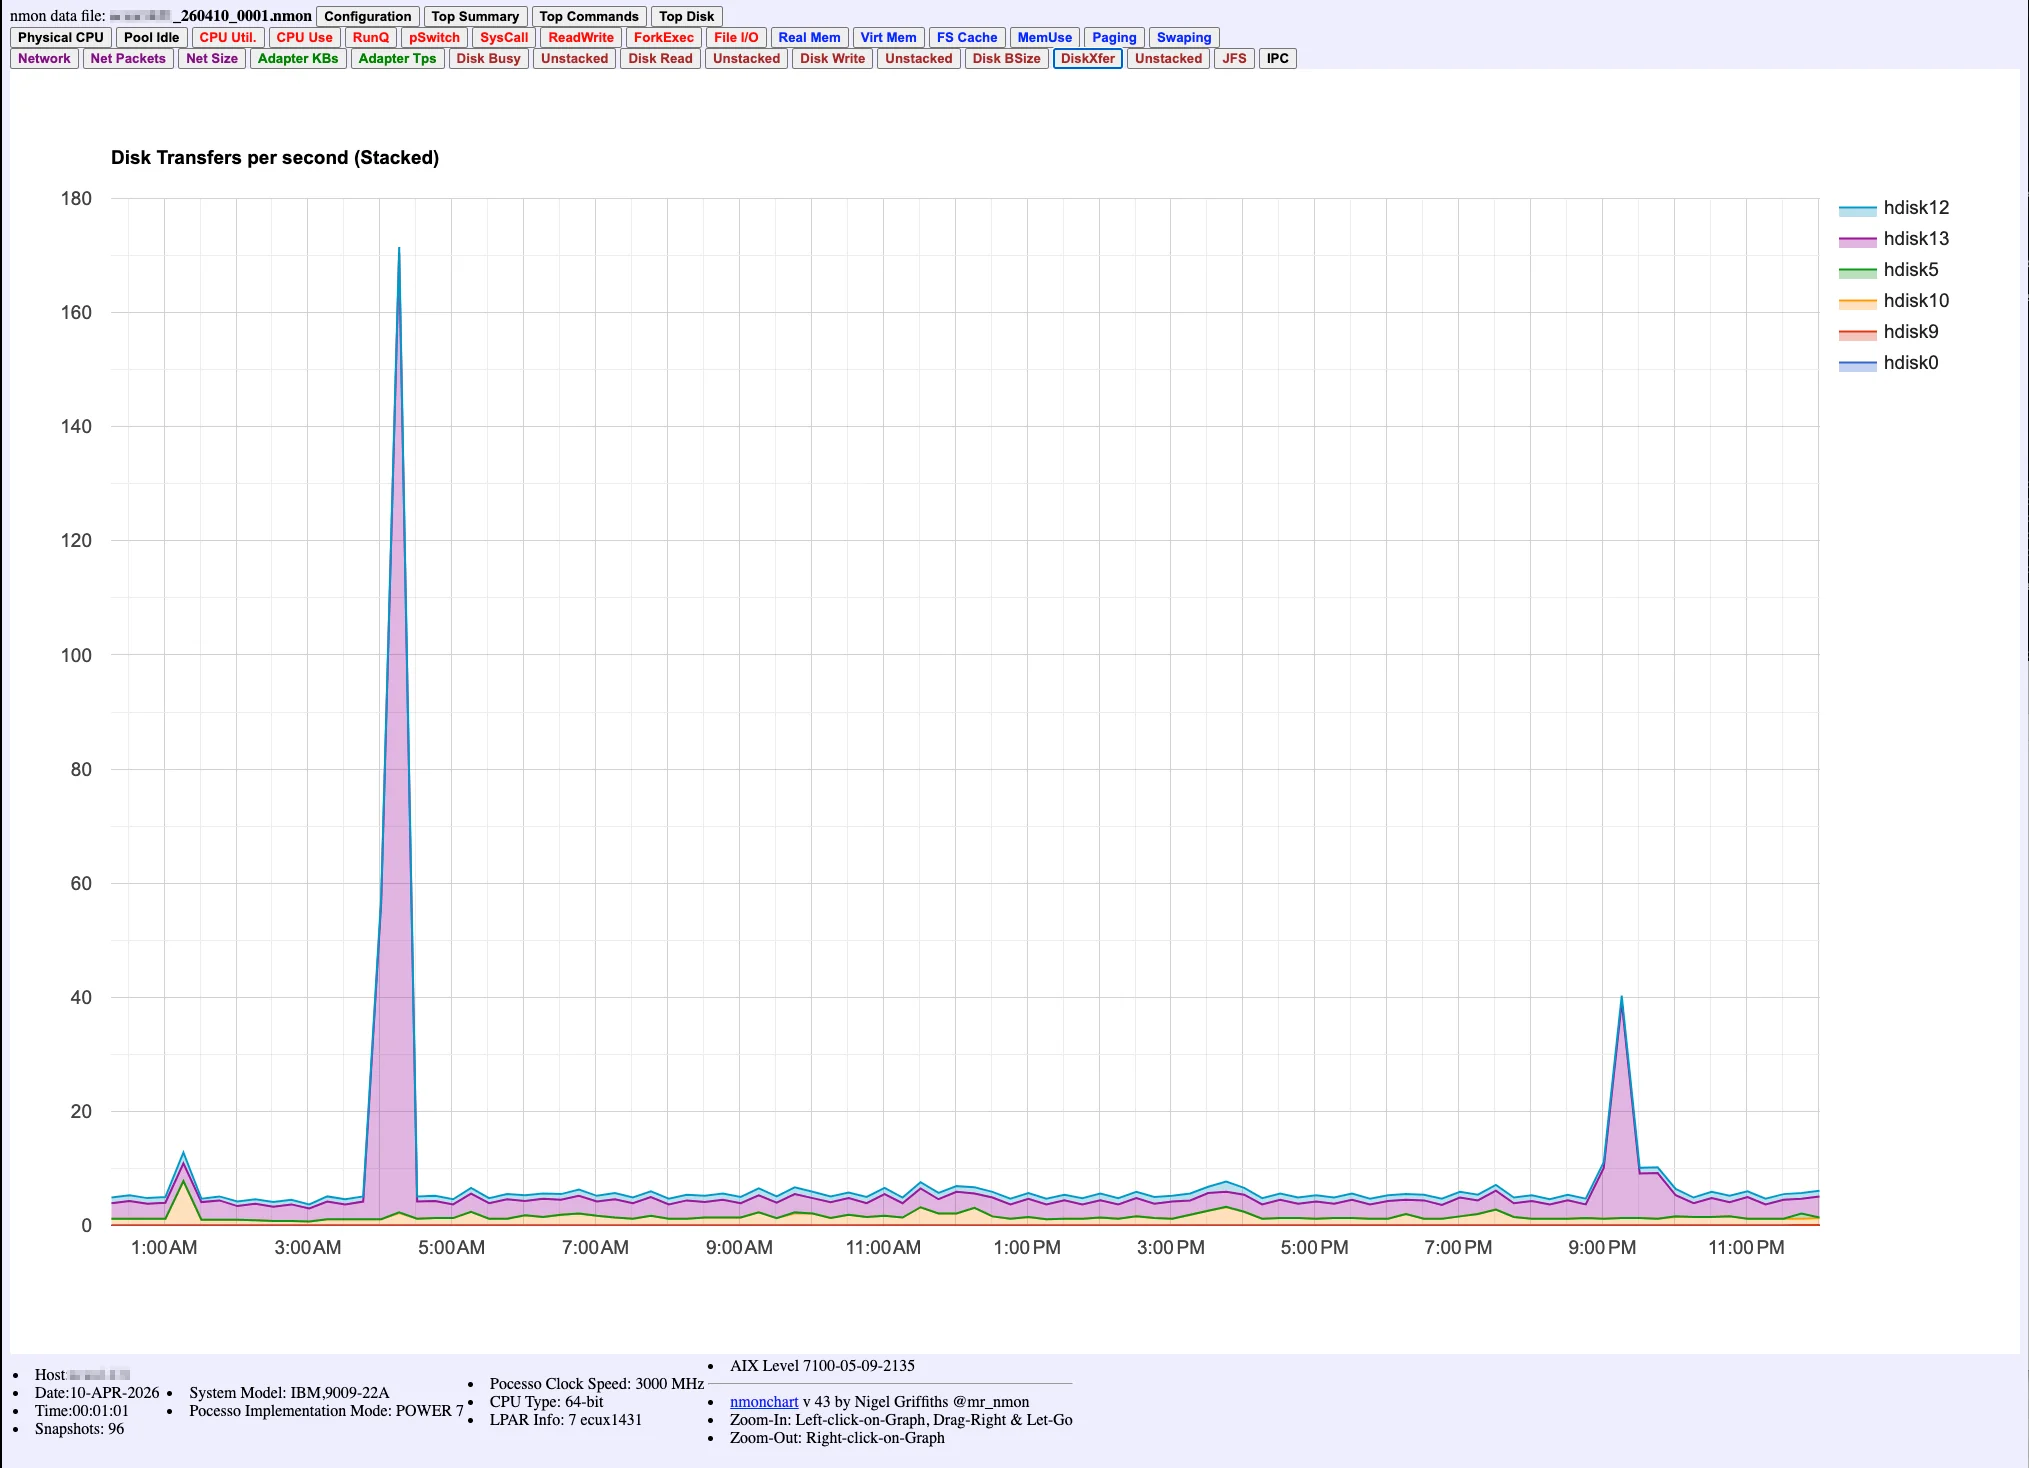
A single nmonchart file, opened Monday morning. The 03:00 AM spike is right there — visible, undeniable, and already 24 hours too late.
One errpt entry. Four days of silence. Six hours of downtime. This is what "no native monitoring" actually costs.
No vanity metrics.
Just what it does.
No inflated stats. No made-up customer count. Just the verifiable facts about what the AIXWatch suite does — and what it doesn't need to do it.
Runtime dependencies
No Python, Java, Node or interpreter to install — anywhere. The AIX agents are native C for POWER (7.1, 7.2, 7.3 on POWER7–10); the HMC exporter is a single static binary, fully agentless.
Layers, one stack
Host metrics, errpt logs, and the PowerVM virtualization layer — three drop-in exporters feeding the same Prometheus and Grafana you already run.
OpenMetrics backend
Prometheus, VictoriaMetrics, Grafana Cloud, Mimir, Thanos — or any OpenMetrics-compatible endpoint. No vendor lock-in.
Every metric. Every LPAR.
Five minutes away.
Native Prometheus for AIX, in 5 minutes. No Linux. No emulation. No workarounds.