AIX Monitoring Free Trial — No Strings Attached
Download. Install. See your AIX metrics in Grafana in under 5 minutes.
No credit card. No sales call. Just create a free account.
Fully functional · 30-day evaluation · no account, no signup wall.
No time limit
AIX-exporter — AIX Monitoring Free Trial
Get a taste of native Prometheus monitoring on AIX. The trial includes 3 core collectors — enough to prove the value to your team.
What’s included
- ✅ CPU collector — per-CPU utilization, user/sys/idle/wait
- ✅ Memory collector — real/virtual, page faults, paging rates
- ✅ Partition collector — entitled capacity, virtual CPUs, weight
- ✅ Standard
/metricsendpoint - ✅ SRC integration & auto-start
- ✅ BFF package —
installpinstall/uninstall
Full version unlocks
- 🔒 19 additional collectors (disk, FC, network, NFS, errpt, load average, protocols…)
- 🔒 60+ panel Grafana dashboard
- 🔒 Volume group & paging space monitoring
- 🔒 LPAR configuration metrics
Install in 60 seconds
# Transfer to your AIX server
scp aix-exporter-trial.1.0.0.2.bff root@aix-server:/tmp/
# Install
installp -aXd /tmp/aix-exporter-trial.1.0.0.2.bff aix-exporter
# Start
startsrc -s aix-exporter
# Verify — metrics are flowing!
curl http://localhost:9100/metrics
v1.0.0.2 — AIX 7.2 / 7.3 — 1.6 MBsha256: c5ec7613f14cdd84c6421f2c2dbca7def89b6e9f081476808618cfc4b866e29emd5: 3810243b9fd88c694bc2538a66e969b6
v1.0.0.2 — AIX 7.1 — 930 KBsha256: 2b329eed4a0afda0f3e8370f42a711fd2e2ec41d82663b42a8f35827223c6c47md5: 52407f66e147b11e38eadb68decb1f49
30-day trial
Loki Agent — AIX Monitoring Free Trial
Full-featured Loki Agent for 30 days. Forward your AIX error logs to Grafana Loki and build alerts on hardware failures, service crashes, and disk errors.
What’s included
- ✅ Full errlog parsing — every errpt entry captured
- ✅ Structured labels — hostname, class, type, resource
- ✅ Real-time forwarding to your Loki instance
- ✅ SRC integration & auto-start
- ✅ BFF package —
installpinstall/uninstall - ✅ Standard & TLS variants available
Example: Alert on hardware errors
# Grafana alert rule — LogQL
count_over_time(
  {job="aix-errpt", errpt_class="H", errpt_type="PERM"}
  [5m]
) > 0
# Get notified instantly when a permanent
# hardware error hits any AIX server
Install in 60 seconds
# Transfer to your AIX server
scp loki-agent-trial.1.0.0.1.bff root@aix-server:/tmp/
# Install
installp -aXd /tmp/loki-agent-trial.1.0.0.1.bff loki-agent
# Configure your Loki endpoint
vi /etc/loki/loki-agent.conf
# Start
startsrc -s loki-agent
v1.0.0.1 — 247 KB (std + TLS)sha256: b7f93e92...3cefamd5: 7635fc6d87fcb031aba15fa5d0633c82
free — 1 managed system
power-hmc-exporter — PowerVM Monitoring Free Trial
Try the full exporter on one managed Power system — shared CPU & memory pools, LPAR ↔ VIOS relationships, and SEA / NPIV / VSCSI attribution, straight from the HMC. One central exporter, nothing installed on your partitions. Add your whole estate with the full license.
What’s included
- ✅ Full view of one managed system — every LPAR & VIOS on the frame
- ✅ Shared CPU & memory pools — entitled vs consumed
- ✅ LPAR ↔ VIOS, SEA, NPIV & VSCSI mapped automatically
- ✅ 3 Grafana dashboards — overview, per-system, per-LPAR
- ✅ Agentless — scrapes the HMC REST API, nothing on your LPARs
- ✅ Static binary + hardened systemd unit
Install in minutes
# Runs on a Linux x86-64 host — NOT your LPARs
# 1. Extract the package (binary + 3 dashboards + docs)
# 2. Point it at your HMC with a read-only (hmcviewer) user
# 3. Start it — metrics exposed on :9105
# 4. Import the 3 included Grafana dashboards
# Exact commands & options are in the included docs (PDF)
v0.10.0 — Linux x86-64 — binary + 3 dashboards + docs — 7.4 MB
From trial to production in 3 steps
1️⃣
Install the trial
Download the BFF, installp, done. Takes 60 seconds. No dependencies to install, no config files to create — defaults work out of the box.
2️⃣
See it in Grafana
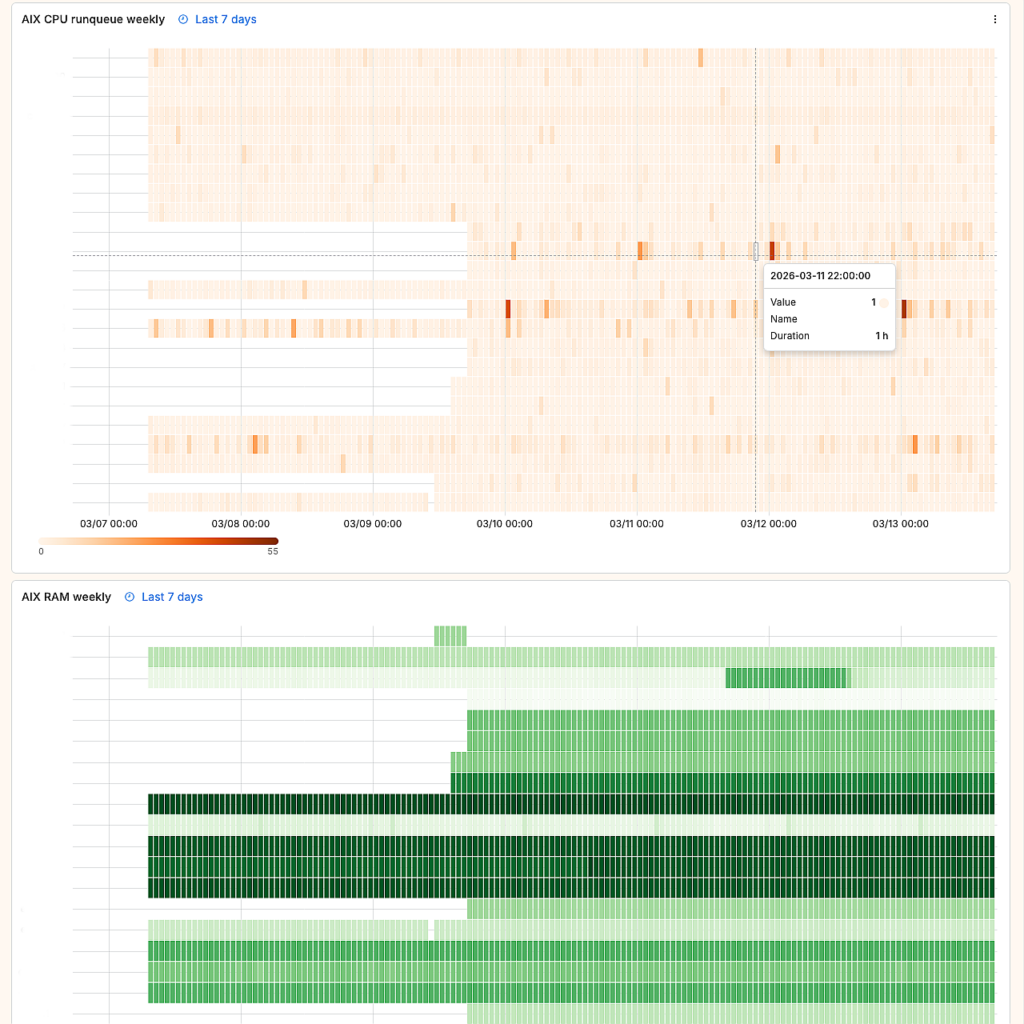
Point Prometheus at your AIX server’s port 9100. Import our Grafana dashboard. Your CPU, memory, and partition metrics are live in minutes.
3️⃣
Upgrade when ready
Convinced? Subscribe, install the full version. Same BFF package, same config. installp -u the trial, installp the full — zero downtime.
AIX Monitoring Free Trial — Frequently Asked Questions
Do I need to register or create an account?
Create a free account to access the download. No credit card, no license key — just your email so we can notify you of updates and security patches.
Which AIX versions are supported?
AIX 7.1, 7.2, and 7.3 on any IBM Power Systems hardware (POWER7 and above, including Power10).
Does the trial phone home or require internet?
No. The software runs entirely offline. No telemetry, no license server, no internet required. Works perfectly in air-gapped environments.
What’s the difference between trial and full?
AIX-exporter: Trial has 3 collectors (CPU, memory, partition). Full unlocks all 22 collectors + Grafana dashboard. No time limit on either.
Loki Agent: Trial is fully functional for 30 days. Same binary, same features — just a time limit.
Can I use the trial in production?
The trial is intended for evaluation. For production use, please purchase the full license. The upgrade is seamless — same config, same paths, no data loss.
How do I uninstall?
Standard AIX package management: stopsrc -s aix-exporter && installp -u aix-exporter.rte. Clean removal — no leftover files, no orphan processes.
Ready to see all 22 collectors?
Upgrade from trial to full — same config, zero downtime, all metrics unlocked.