ABOUT AIXWATCH
We Build What AIX Was Missing
AIXWatch builds native AIX monitoring for IBM Power Systems — the Prometheus exporters and Loki agents that should have existed all along. 500,000+ AIX LPARs run worldwide, and until now not one native way to watch them. We fixed that.
Why AIX monitoring was broken
The open-source monitoring world runs on Linux. Prometheus, Grafana, Loki, Alertmanager — brilliant tools, battle-tested at scale. But they were never built for AIX.
The official node_exporter relies on /proc and Linux syscalls. It doesn’t compile on AIX. Promtail and Alloy are written in Go — which doesn’t support AIX. The AIX error log (errpt) uses a binary format that no standard log agent can read.
The result? Enterprise teams running mixed Linux/AIX environments are forced to maintain two separate monitoring stacks — or settle for SNMP workarounds and shell-script hacks that break at the worst possible moment.
We decided to build what should have existed all along: native, production-grade AIX monitoring agents for Power Systems.
Our Principles
Built Native, Not Ported
Written in C using libperfstat — the same API IBM uses internally. Not a wrapper, not an emulation layer. Real AIX system calls, real performance data.
Your Data Stays Yours
No SaaS. No telemetry. No phone-home. No cloud dependency. The agents run entirely on-premises. Your metrics never leave your infrastructure. Air-gap compatible.
Zero Bloat
No Python. No Java. No Node.js. No runtime dependencies. A single static binary under 2 MB. Installs in 60 seconds with standard installp. Starts via SRC.
Fair Pricing
One simple annual subscription per LPAR — updates, new releases and support always included. Volume tiers built into the AIXwatch Suite for larger deployments.
Enterprise-Ready
BFF packaging. SRC subsystem integration. Inittab auto-start. Clean installp -u uninstall. Built the way AIX admins expect software to work.
One Unified Stack
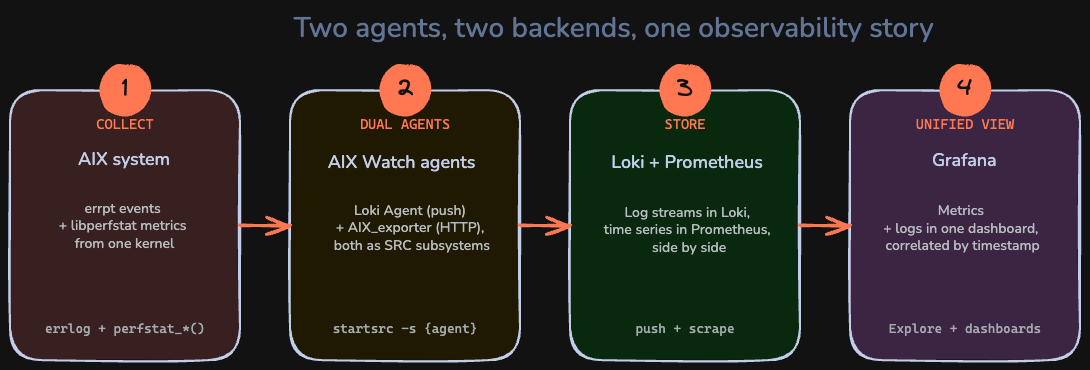
Your AIX servers appear alongside your Linux fleet in the same Prometheus, Grafana, and Loki stack. One pane of glass. No more blind spots.
Who We Are
AIXWatch is built by Strava Ltd, based in Nicosia, Cyprus. Our team brings over 20 years of hands-on experience with UNIX systems, enterprise storage, and infrastructure monitoring — specifically in the environments where AIX runs: banking, telecoms, government, and healthcare.
We’re not a VC-funded startup chasing the next buzzword. We’re engineers who manage AIX systems daily and got tired of monitoring blind spots. We built the tools we needed, and now we’re sharing them with the community.
“Every AIX admin knows the frustration: you set up beautiful Grafana dashboards for your Linux servers, and then there’s this gap where your Power Systems should be. We built AIXWatch to close that gap — for ourselves first, and then for everyone else running AIX in production.”
The technology behind our AIX monitoring
Our agents are written in C and compiled natively for AIX on Power Systems. They feed metrics and logs straight into the open-source stack your Linux fleet already uses — no extra middleware, no separate pane of glass.
Platform:     IBM AIX 7.1 / 7.2 / 7.3
Architecture: POWER7, POWER8, POWER9, Power10
Language:     C (GCC)
Metrics API:  libperfstat (IBM)
Packaging:    BFF (installp)
Init:         SRC subsystem + inittab
Dependencies: gcc-libs
Get in Touch
Questions about AIX monitoring, licensing, or a proof-of-concept on your own Power hardware? We’d love to hear from you.
Strava Ltd — 11 Zinonos Sozou Street, 1st Floor, 1075 Nicosia, Cyprus
Quick Answers
Is AIXWatch really agent-native, or just an SNMP wrapper?
Fully native. Every collector is written in C against libperfstat and the AIX kernel — the same interfaces IBM uses internally. There is no SNMP polling, no shell scraping, and no Linux compatibility layer in the data path.
Which AIX and POWER versions do you support?
AIX 7.1, 7.2 and 7.3 on POWER7 through Power10. The agents ship as a single BFF installed with installp and started under SRC — no extra runtimes required.
Does any AIX monitoring data leave my network?
Never. The agents expose metrics to your own Prometheus and ship logs to your own Loki. Nothing phones home, and the whole stack is air-gap compatible.
How is it licensed?
Annual subscription per LPAR, billed through Stripe — updates and support always included, cancel anytime. Volume tiers apply to larger Power estates through the AIXwatch Suite. Try everything free first via the trial downloads.
Ready to close the monitoring gap?
Try our agents for free. See your AIX metrics in Grafana in under 5 minutes.