AIX Monitoring
AIX-exporter v1.0.0.2
Native Prometheus exporter for IBM AIX – 22 collectors, 600+ metrics covering CPU, memory, disk, FC, network, NFS, errpt and more. Requires only gcc-libs, BFF packaged, SRC integrated. Grafana dashboard included.
AIX_exporter — Native Prometheus Exporter for IBM AIX
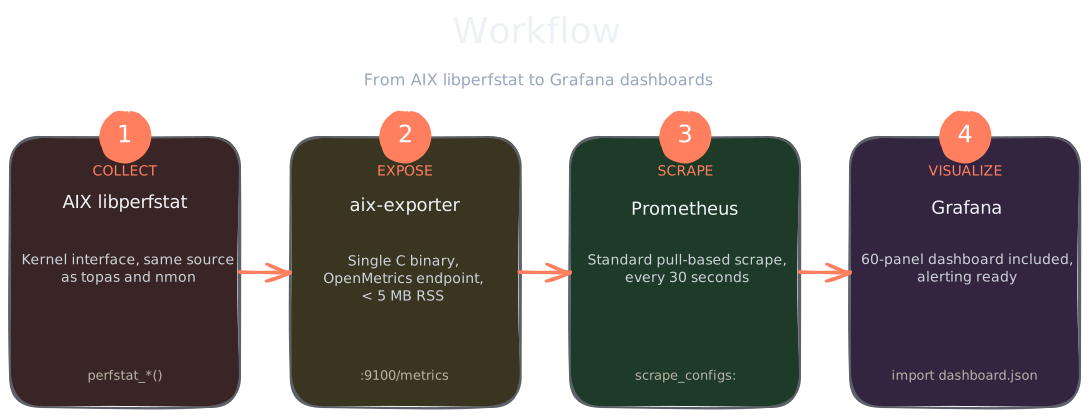
AIX_exporter brings modern observability to your IBM Power Systems infrastructure. Written in C with libperfstat, it runs as a lightweight single binary with zero external dependencies — drop it on any LPAR and start scraping standard Prometheus metrics in minutes.
Built for AIX
Drop-in Prometheus exporter for IBM Power
Single C binary built on libperfstat — same kernel interface as topas and nmon. Under 1% CPU, under 5 MB RSS, no compilers needed, no external runtime. Just installp and start.
# installp -aXcd /tmp/aix-exporter.1.0.0.2.bff aix-exporter.rte
+-----------------------------------------------------------------+
                    Pre-installation Verification...
+-----------------------------------------------------------------+
SUCCESS: aix-exporter.rte 1.0.0.2

# startsrc -s aix-exporter
0513-059 The aix-exporter Subsystem has been started.
         Subsystem PID is 6291602.

# curl -s http://localhost:9100/metrics | head -6
# HELP aix_load1 1-minute load average
# TYPE aix_load1 gauge
aix_load1 0.42
# HELP aix_node_uptime_seconds System uptime in seconds
# TYPE aix_node_uptime_seconds gauge
aix_node_uptime_seconds 1738294
Comprehensive coverage
Every metric your ops team actually needs
CPU, memory, paging, file systems, NFS v3/v4, fibre channel, MPIO, partition config, errpt, load — all the AIX-specific signals exposed in a Prometheus-friendly format. 22 collectors, 137 metrics, 600+ time series per LPAR.
Tunable
Enable only what you need
22 toggles in /etc/aix-exporter/aix-exporter.conf let you scope the exporter to the metrics that matter on each LPAR. No flood of irrelevant series, no wasted scrape time, smaller bills on managed Prometheus.
# AIX_exporter configuration

# Network
port = 9100
bind = 0.0.0.0

# Sampling
sample_interval = 30

# Collectors — 22 available, "all" for everything
collectors = cpu, mem, disk, fs, nfs, errpt, lpar

# Per-collector tuning
disk_devices_pattern = hdisk[0-9]+
fs_exclude = /proc, /tmp
OpenMetrics compatible
Drop into your existing scrape config
Listens on a single TCP port (default 9100), serves OpenMetrics, plays nice with Prometheus 2.x and 3.x. Add the target, scrape, alert. The included Grafana dashboard with 60+ panels gets you visualizing in minutes.
# prometheus.yml — add the AIX_exporter scrape job
scrape_configs:
  - job_name: 'aix'
    scrape_interval: 30s
    static_configs:
      - targets:
          - 'lpar-prod-01:9100'
          - 'lpar-prod-02:9100'
          - 'lpar-prod-03:9100'
        labels:
          env: production
          os: aix
Workflow
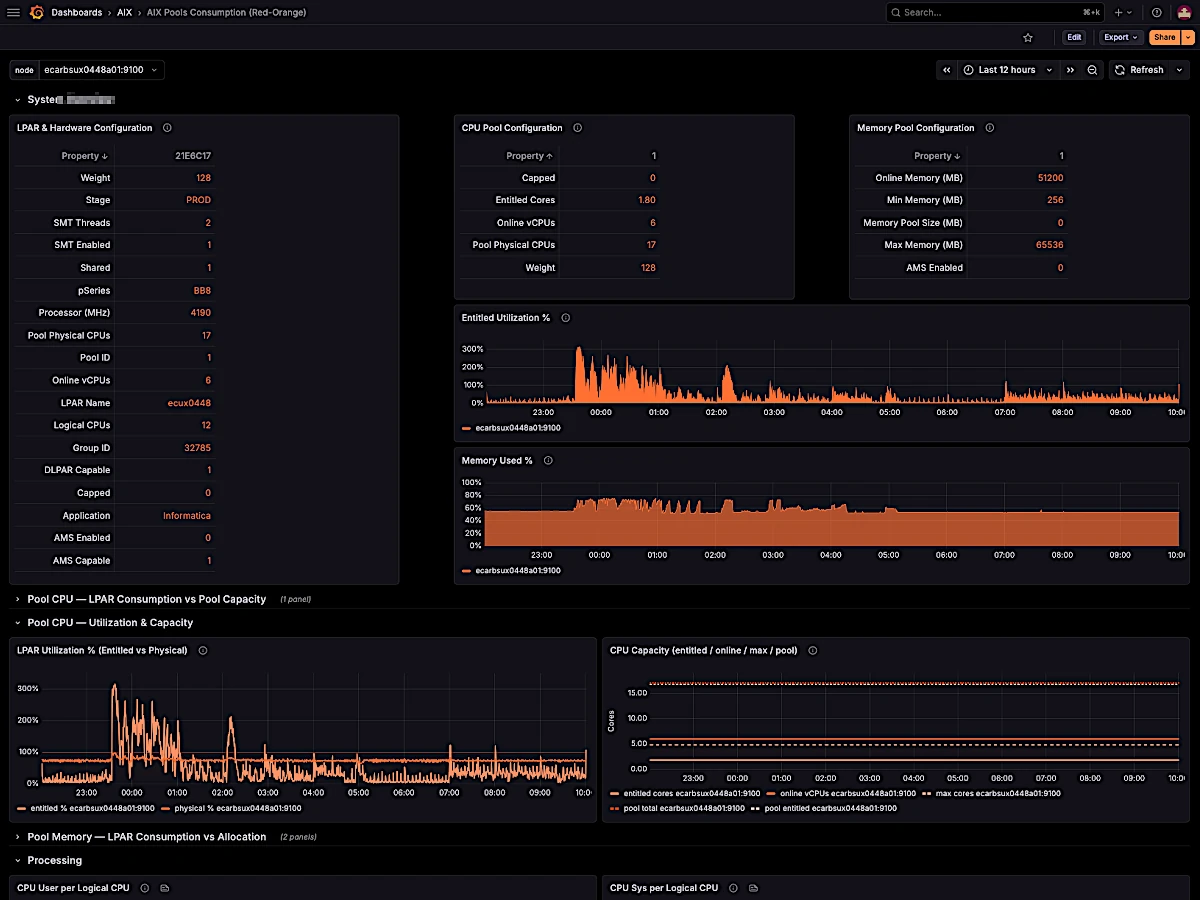
60-panel Grafana dashboard, included
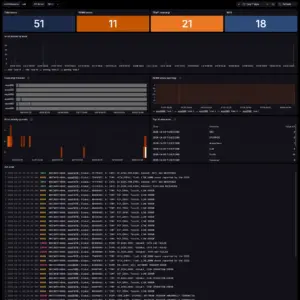
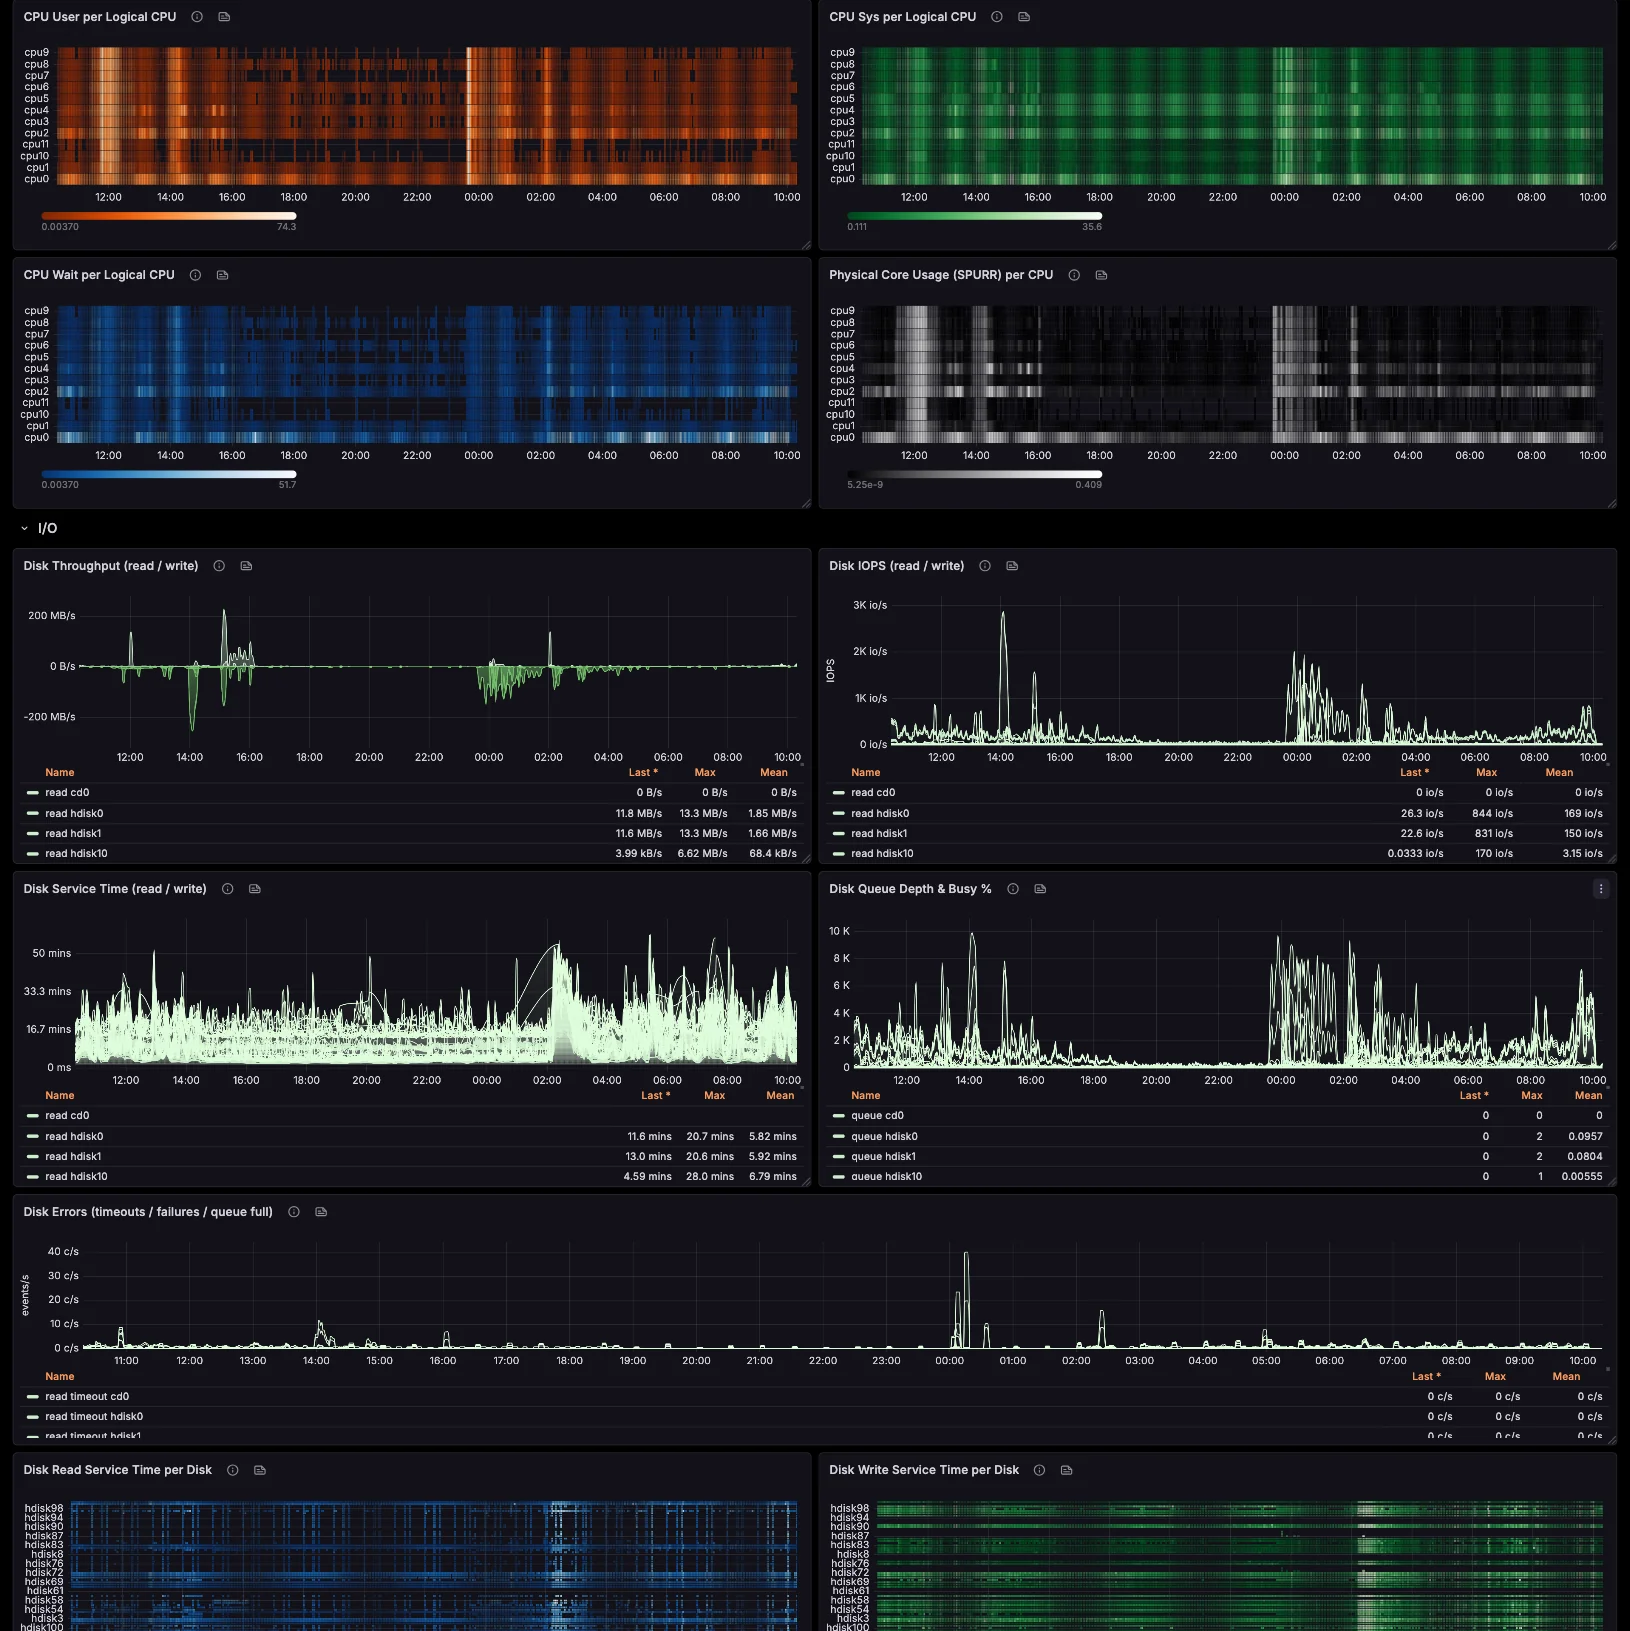
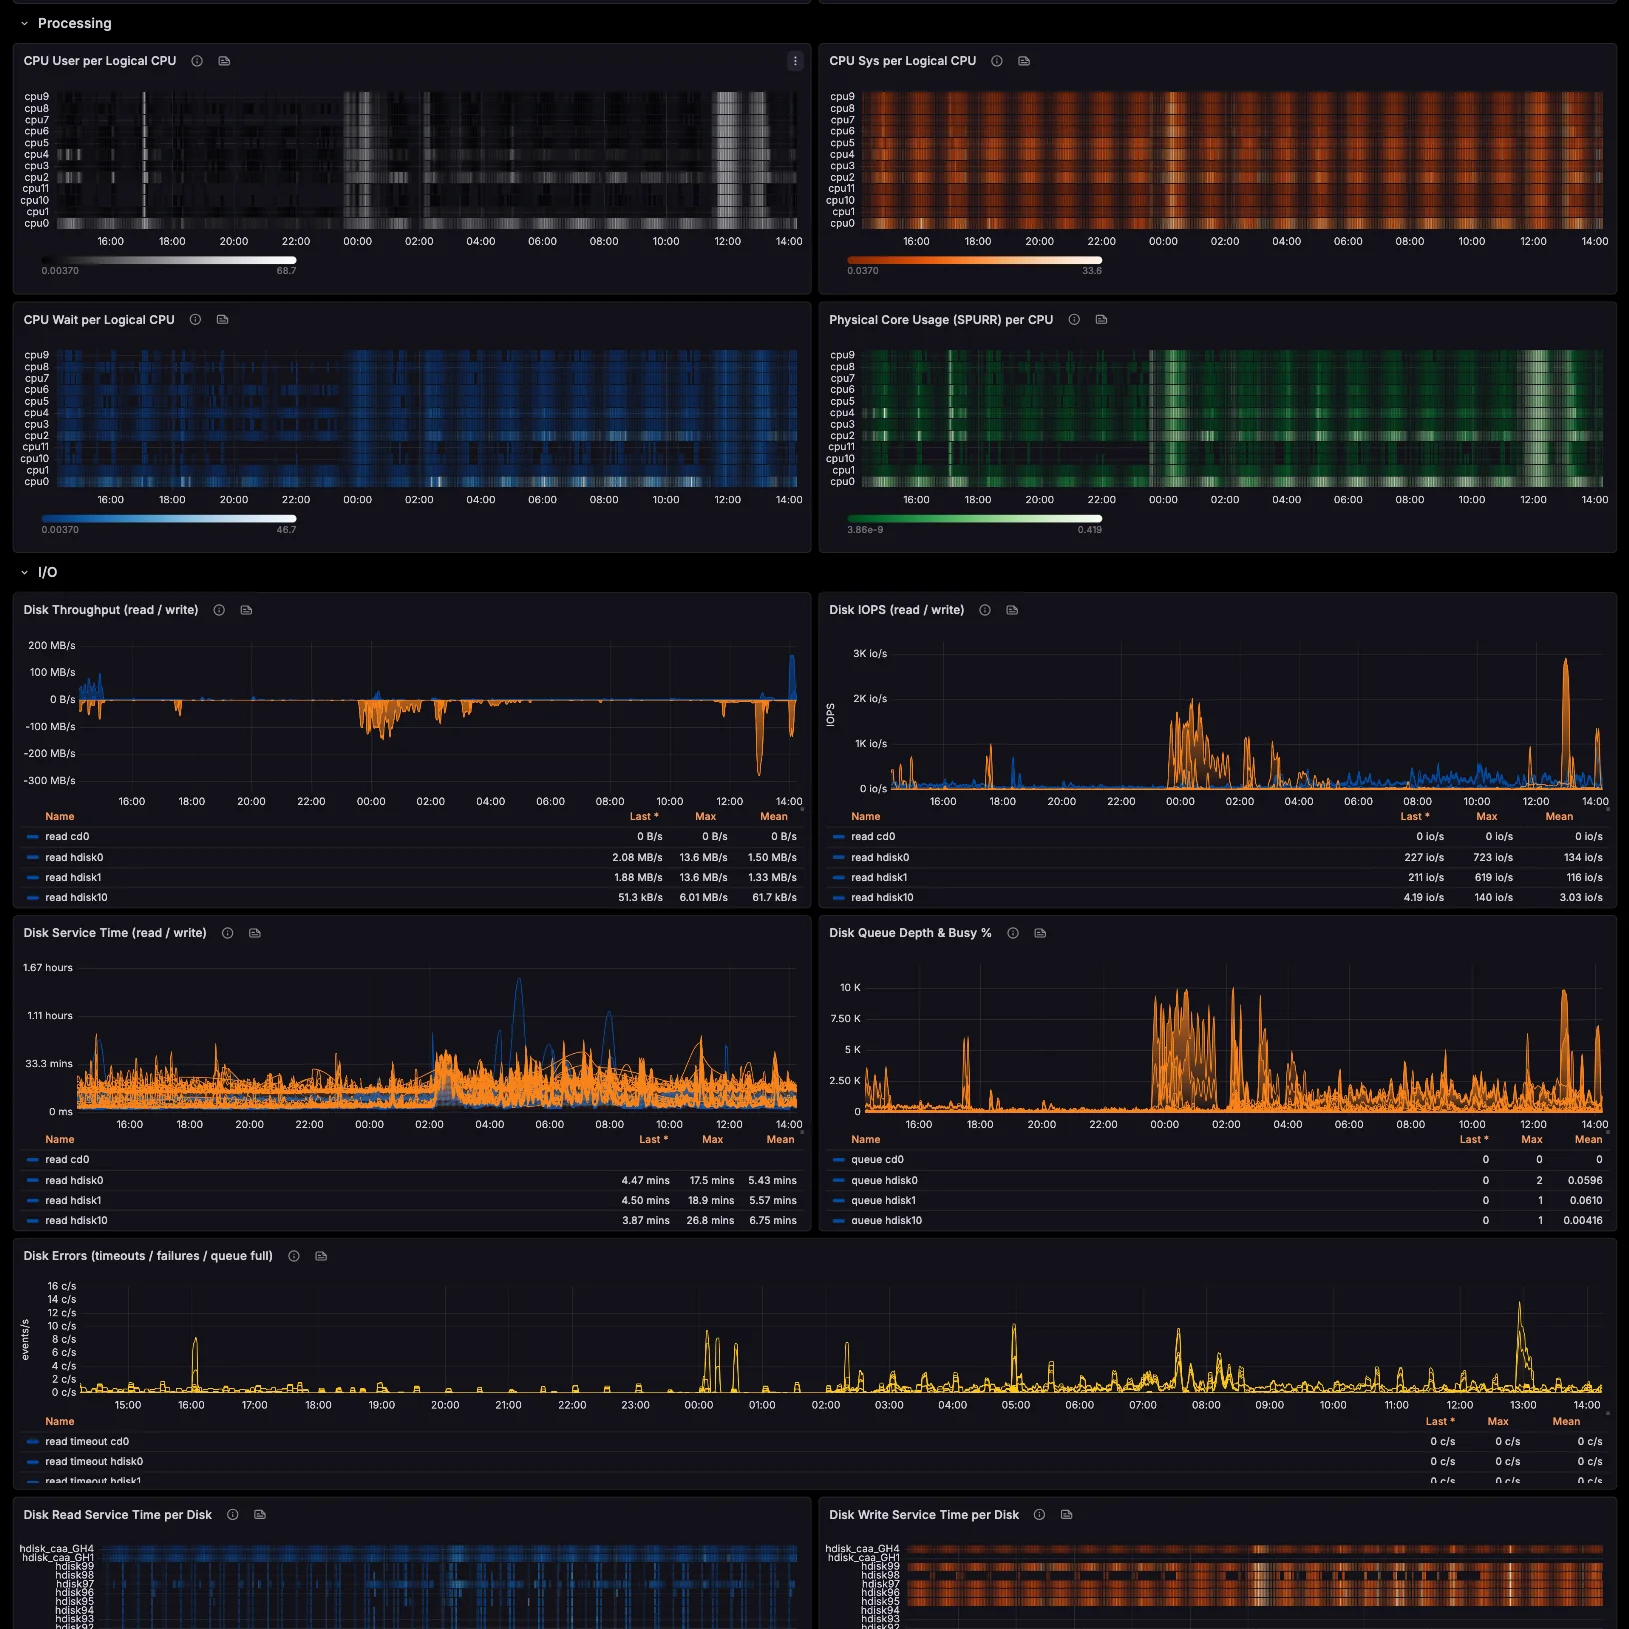
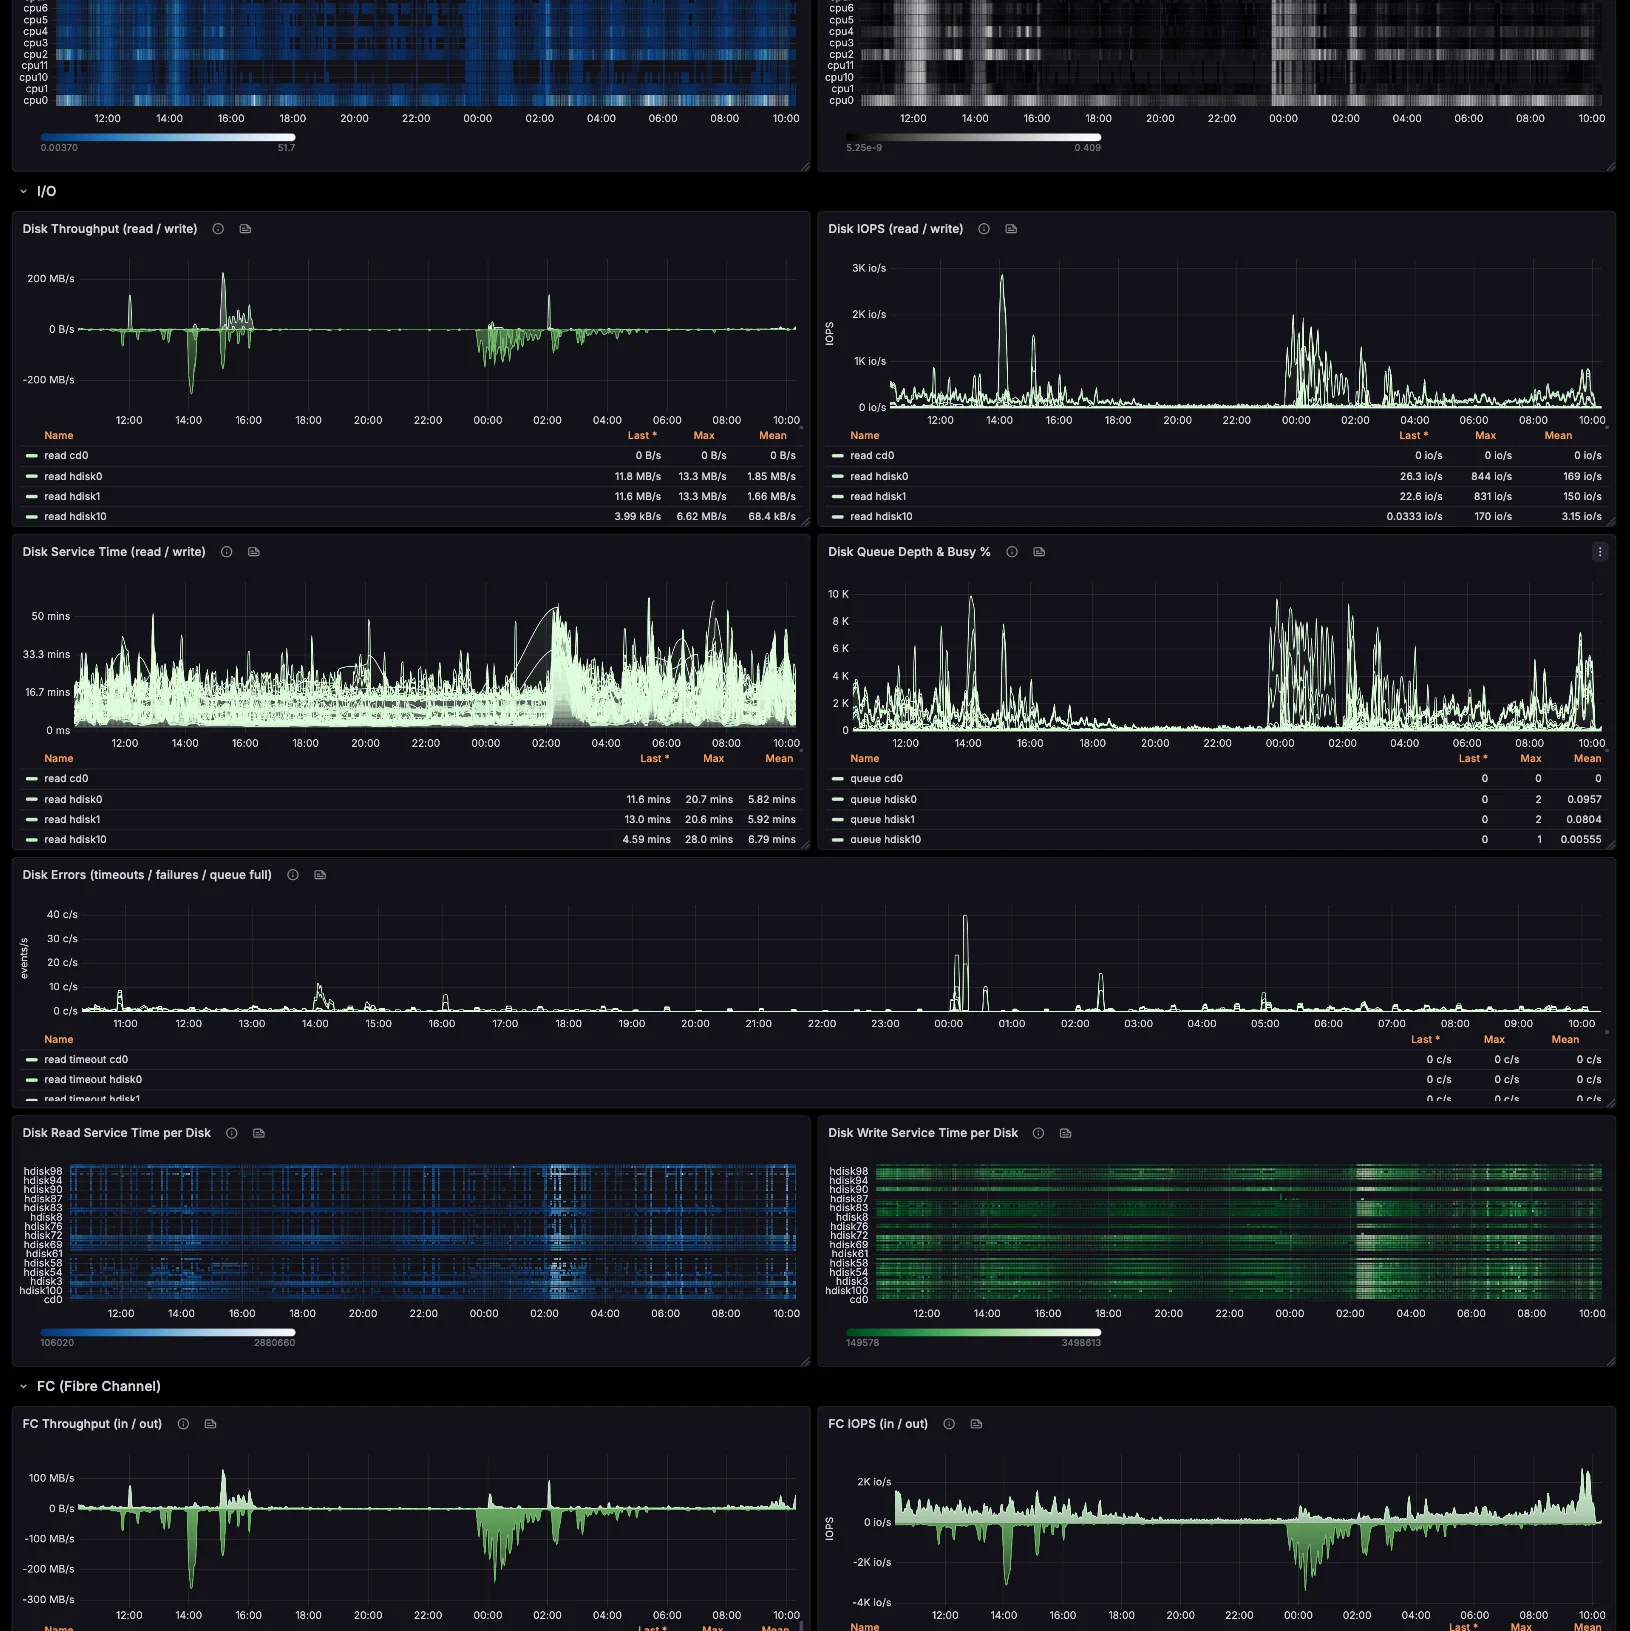
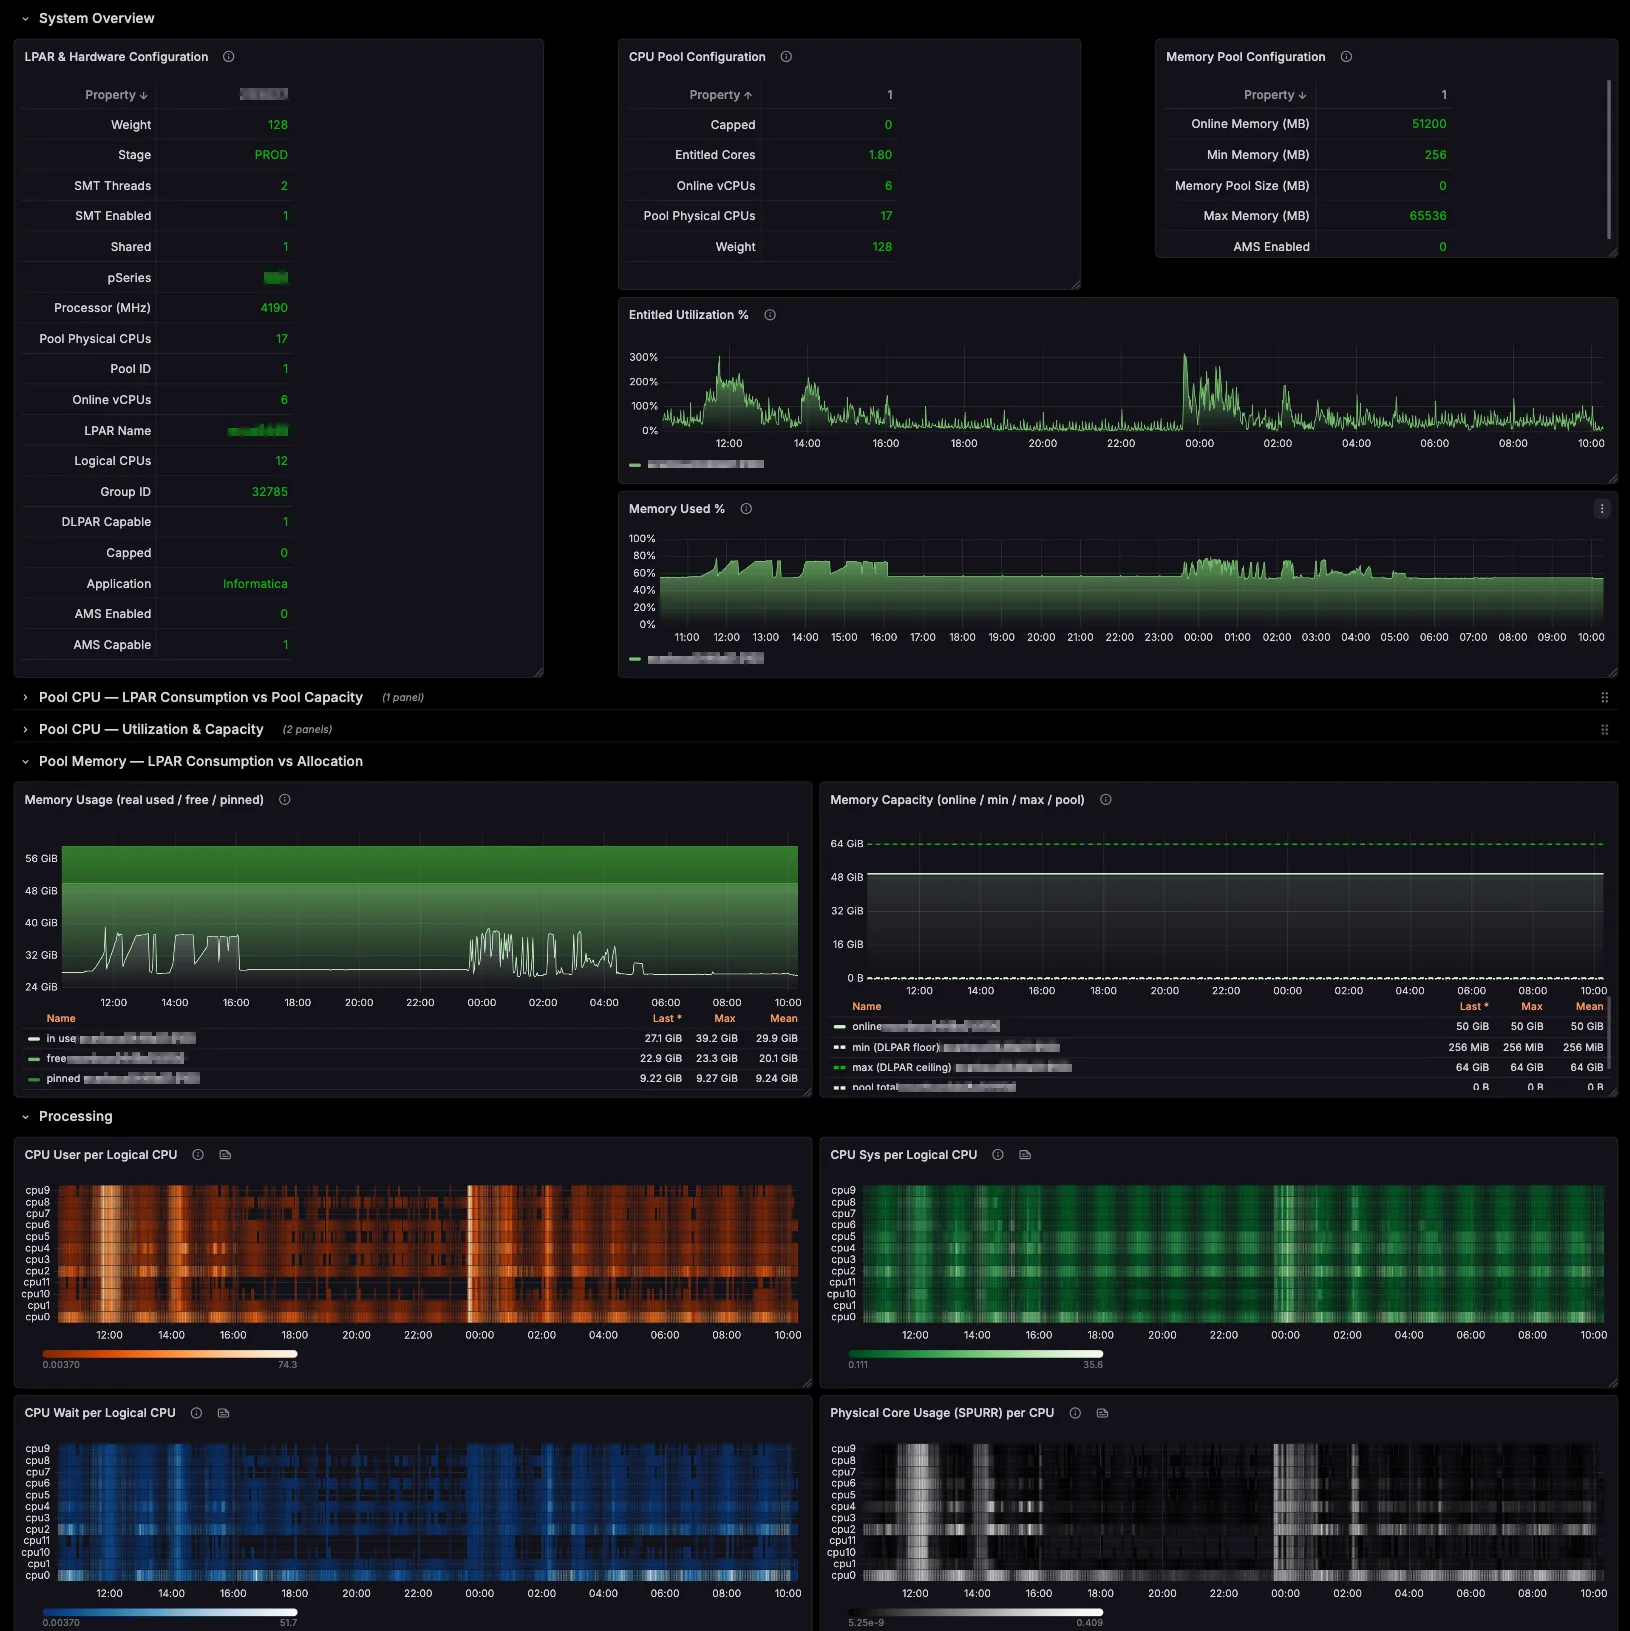
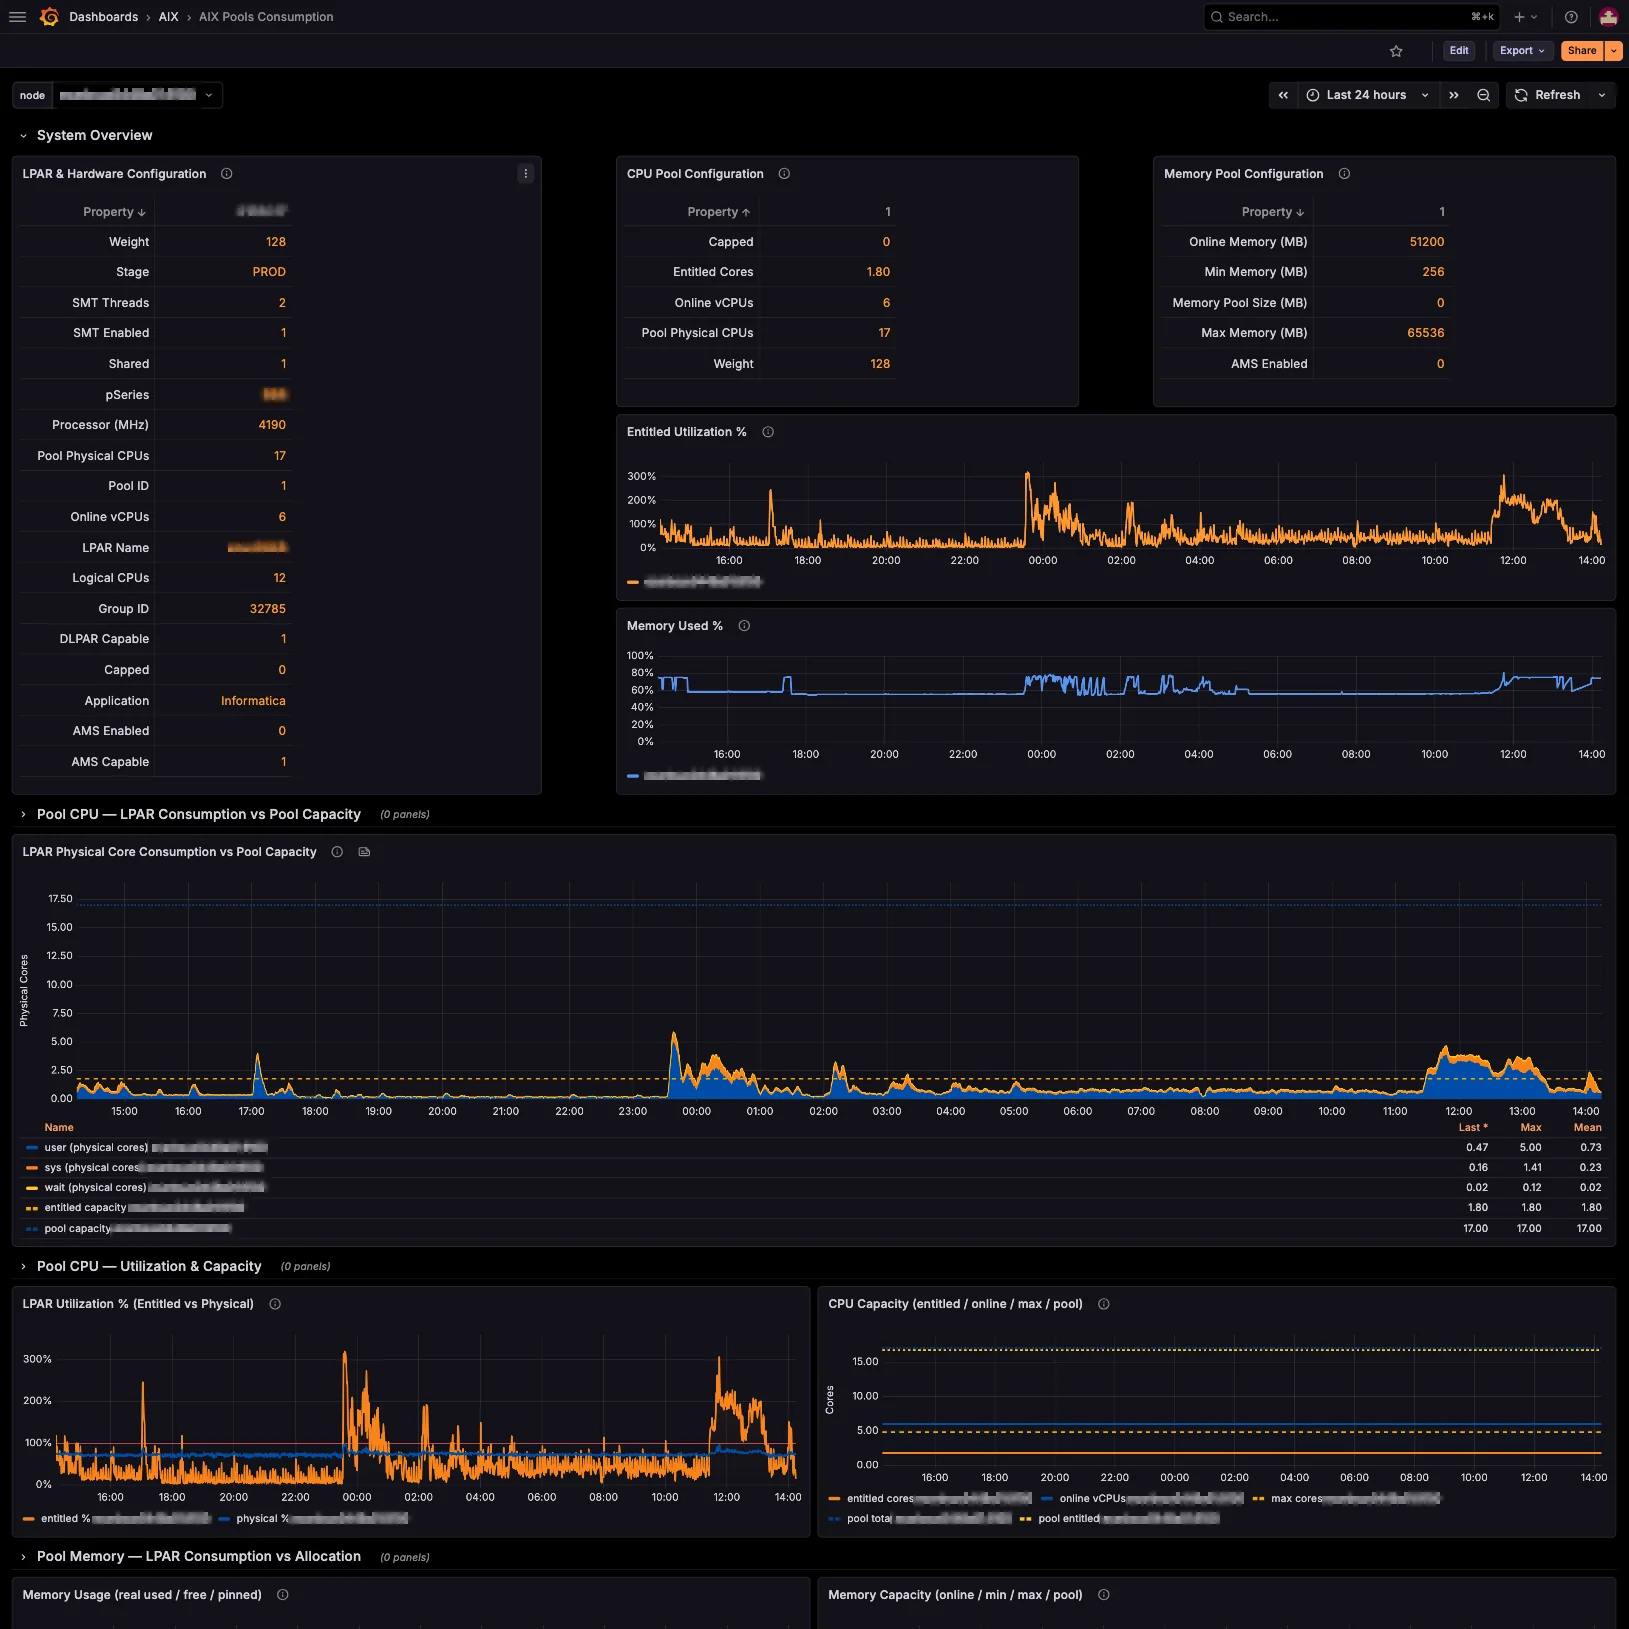
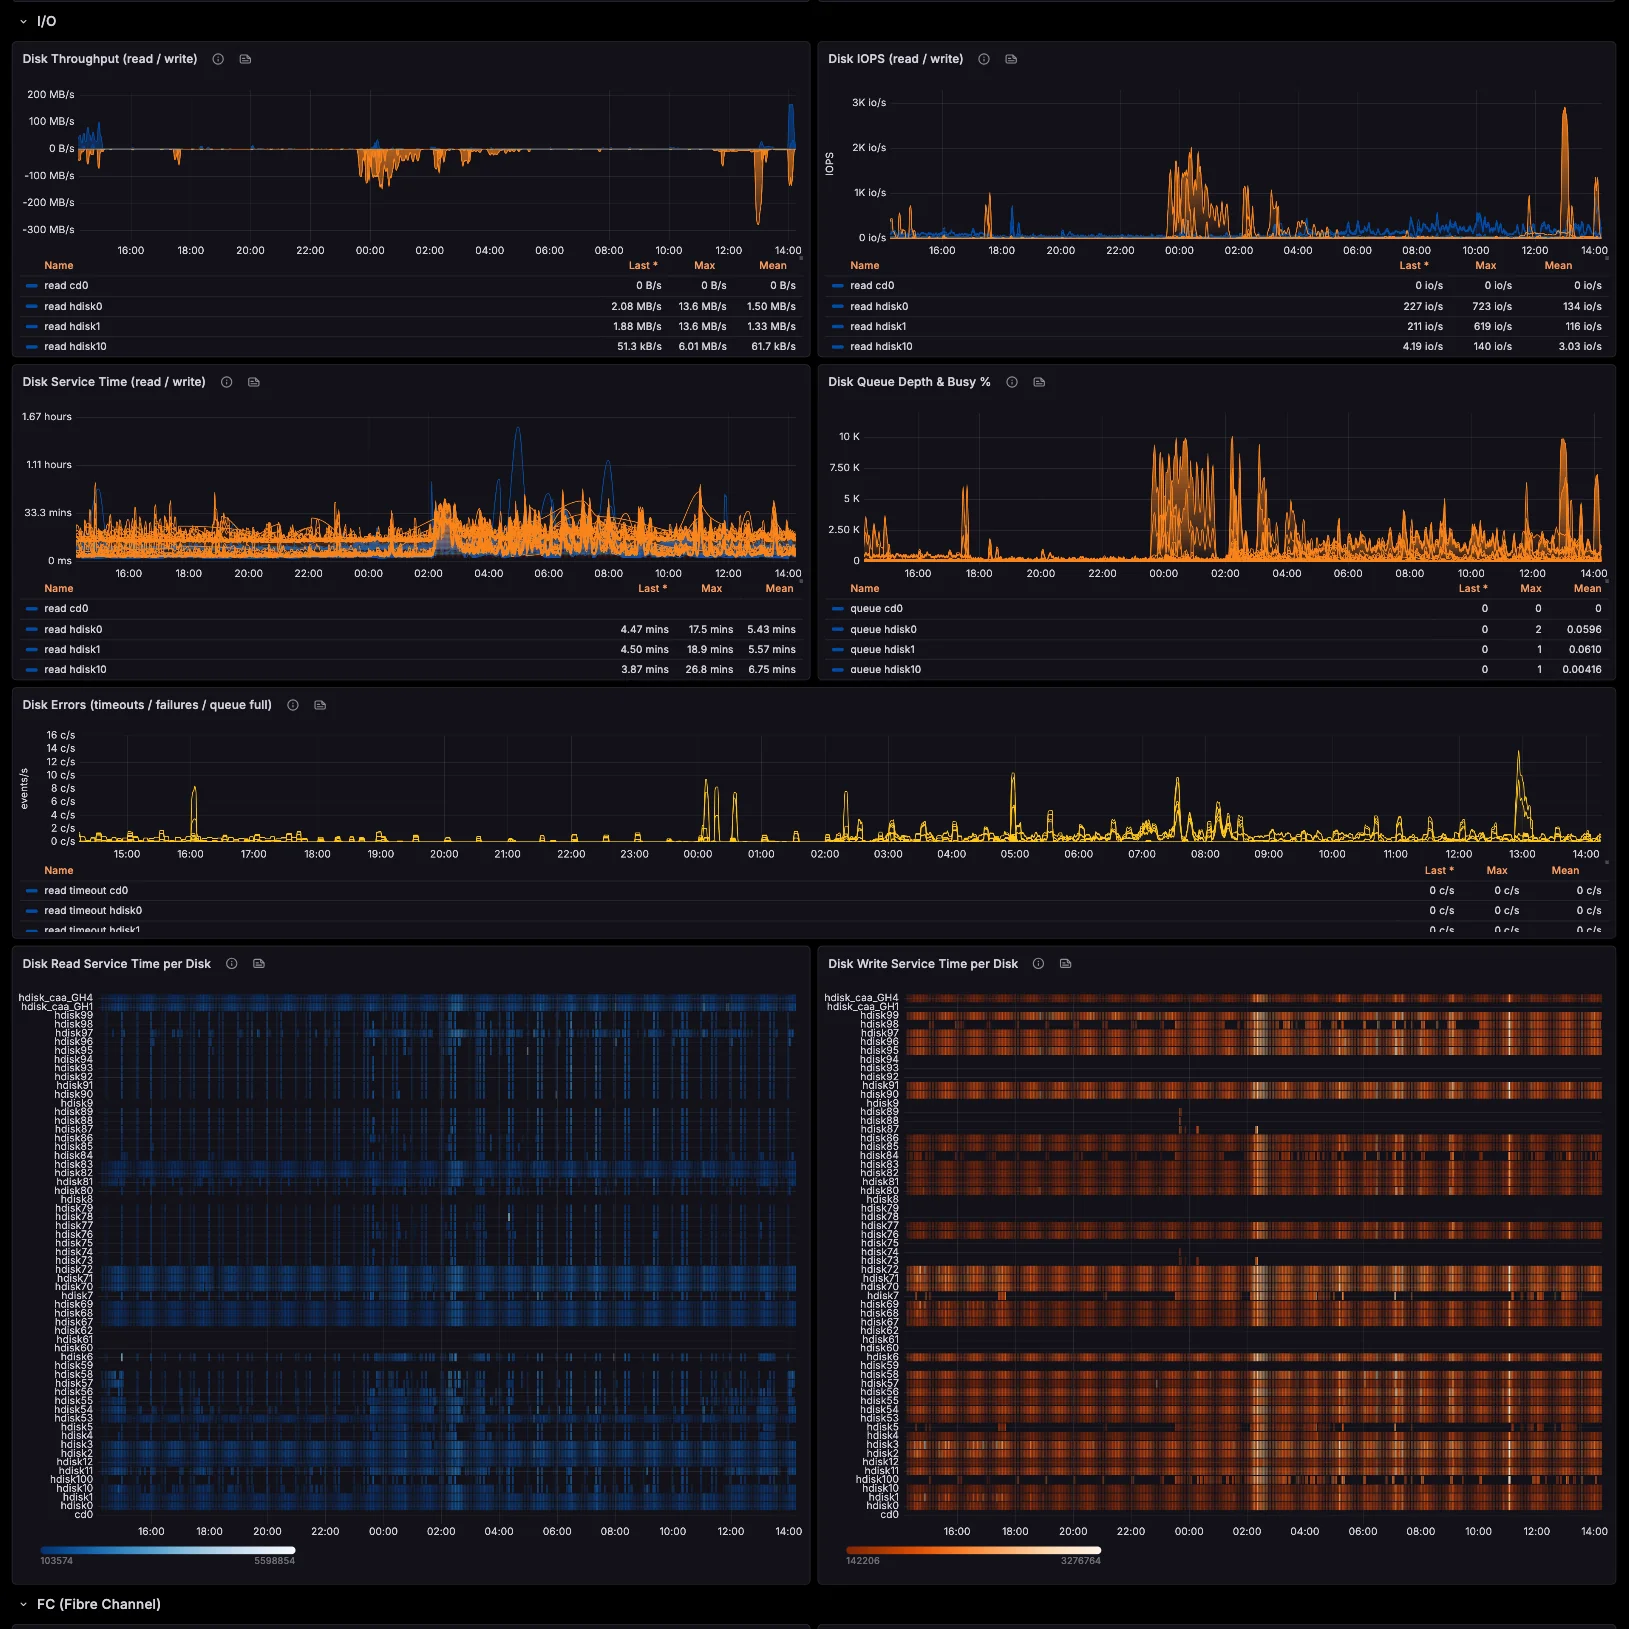
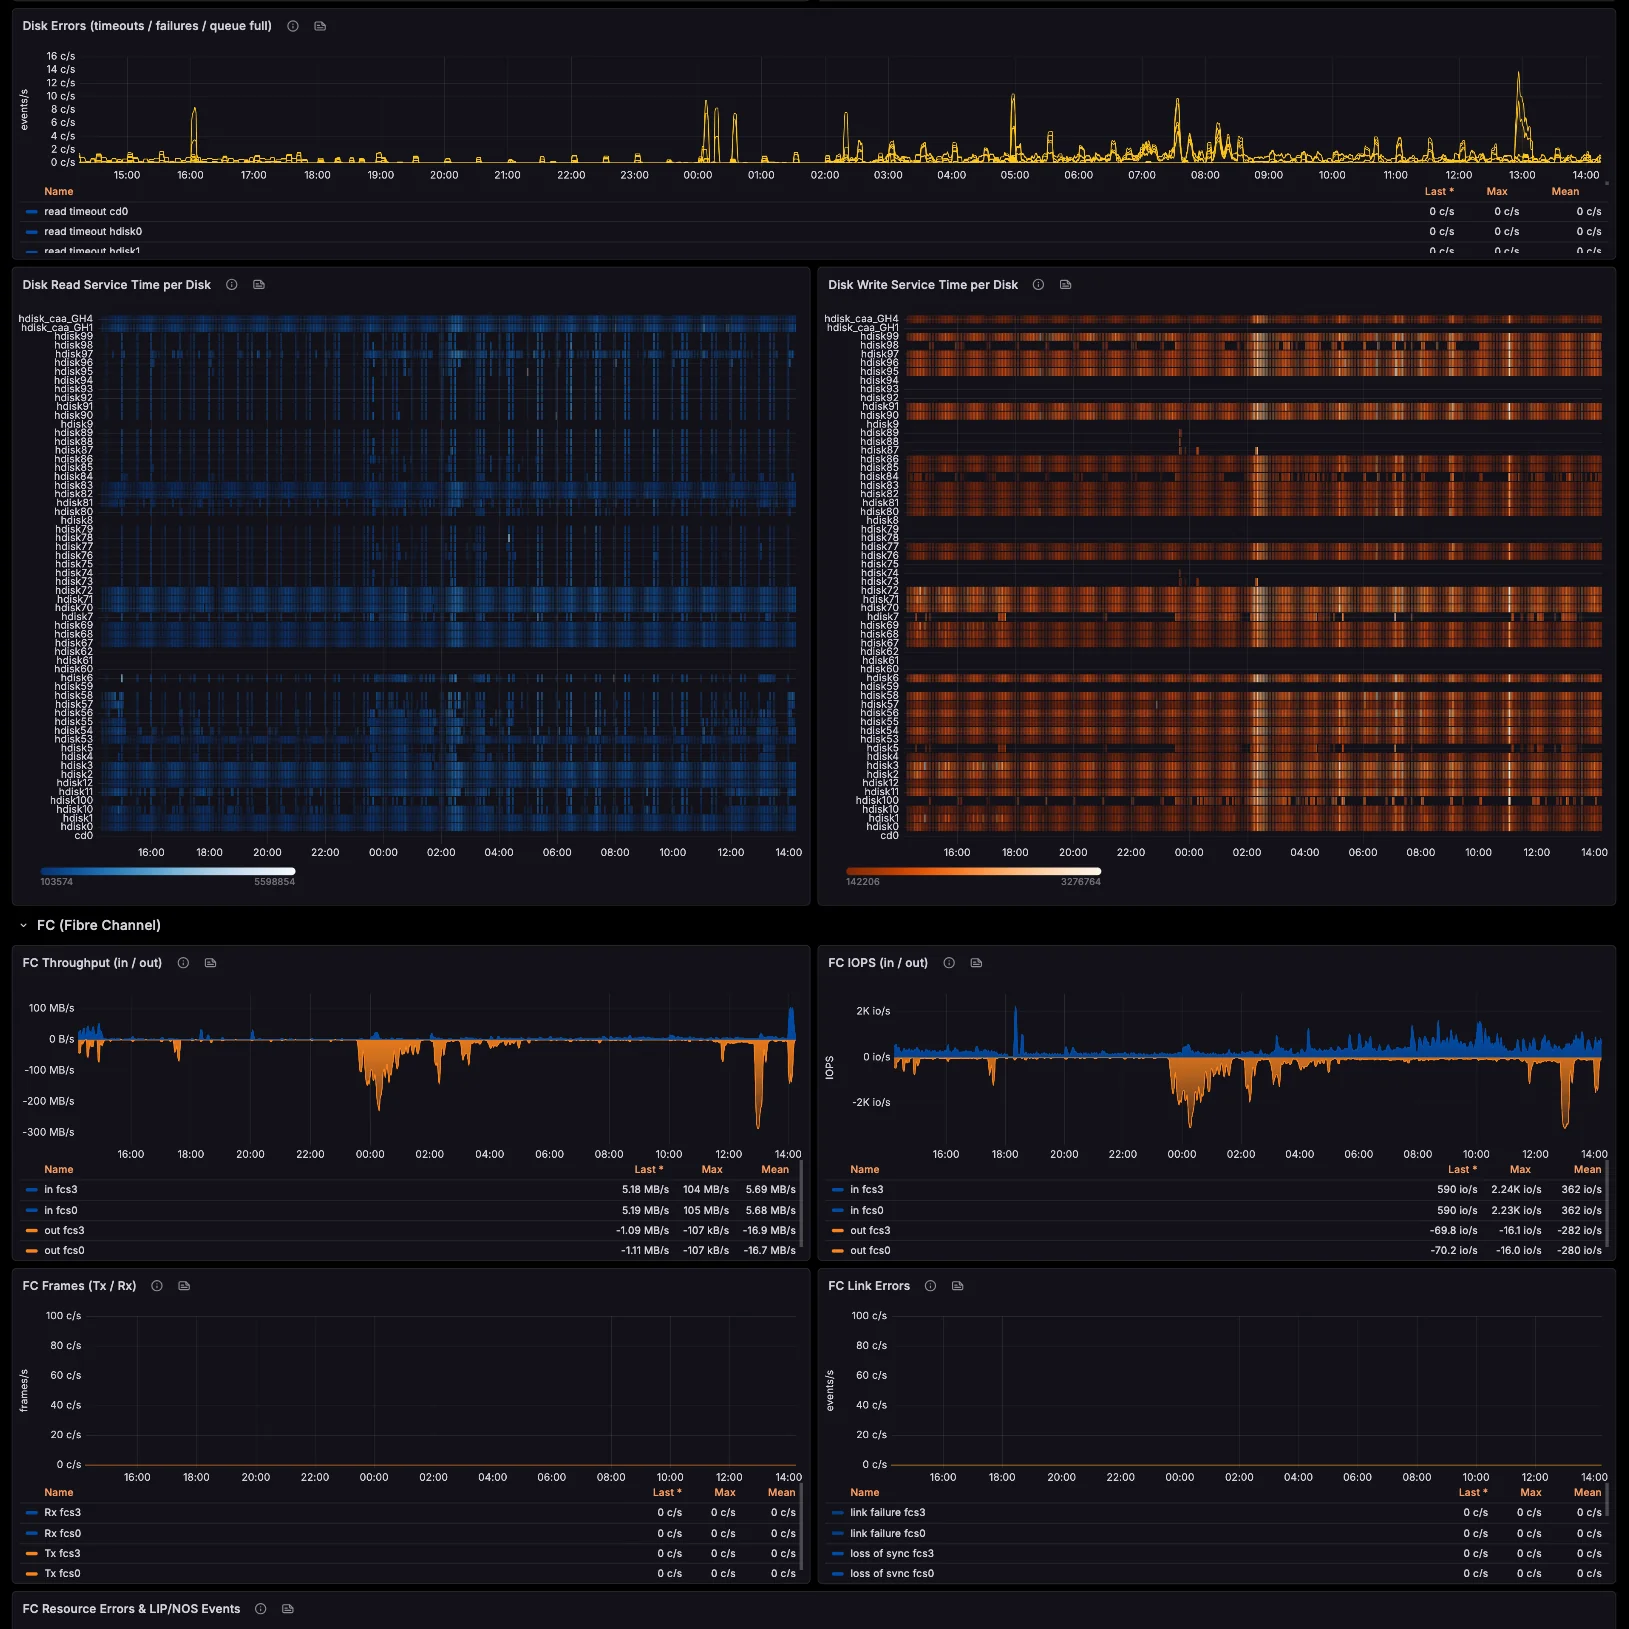
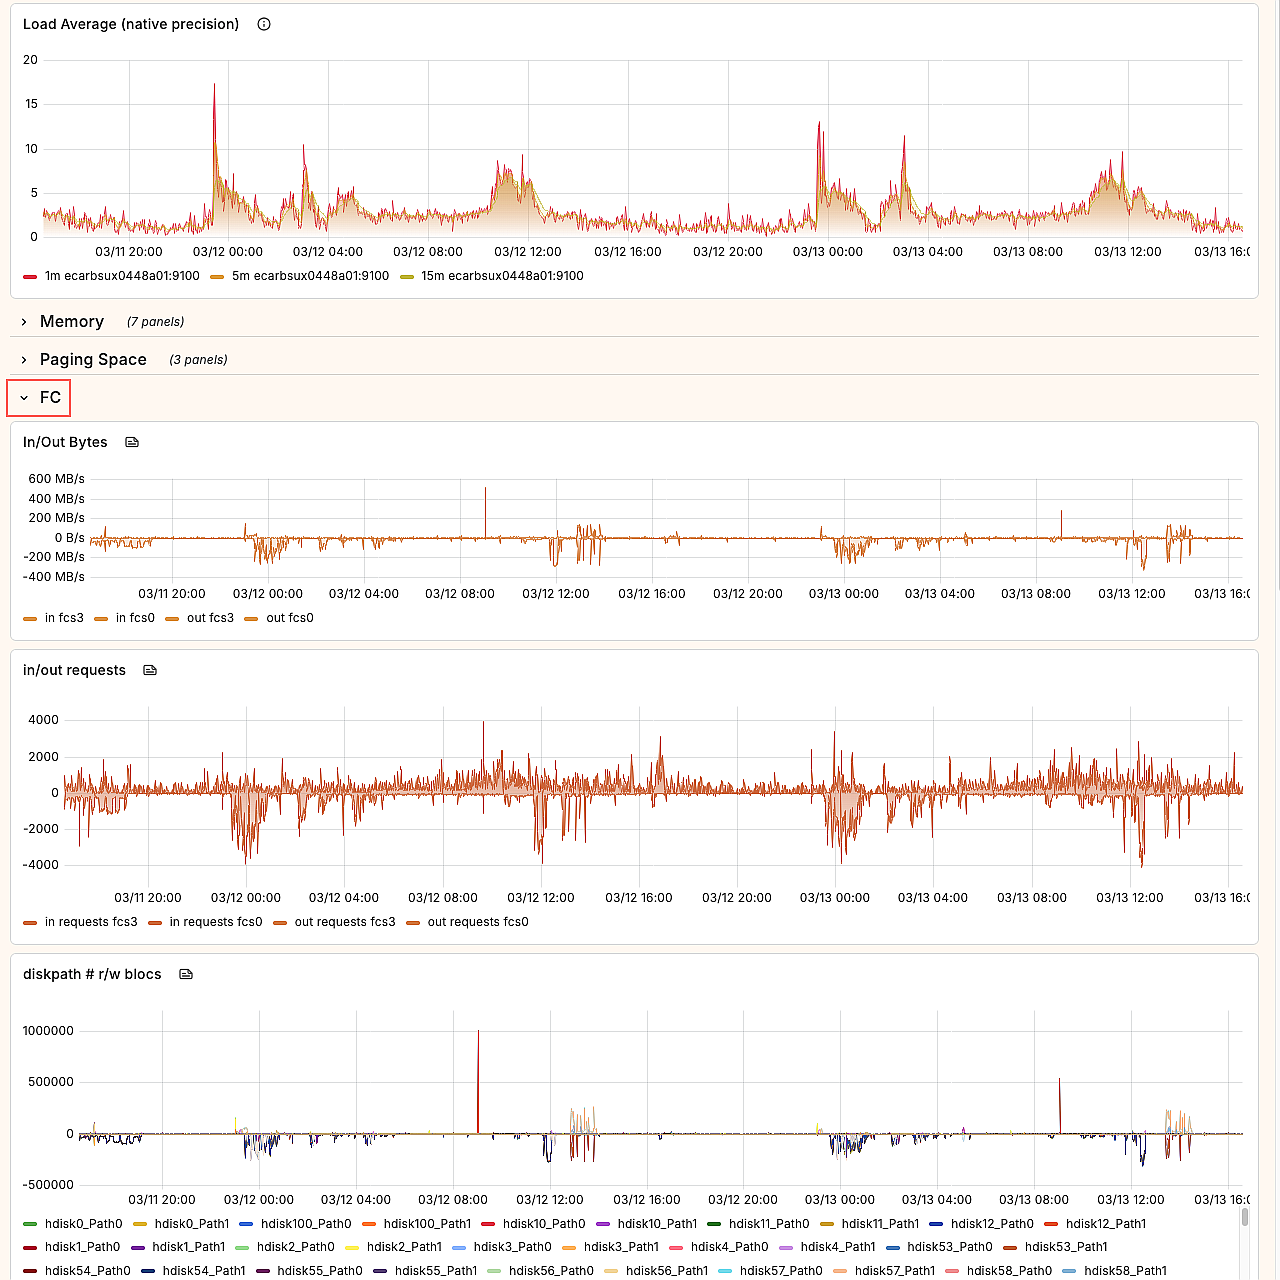
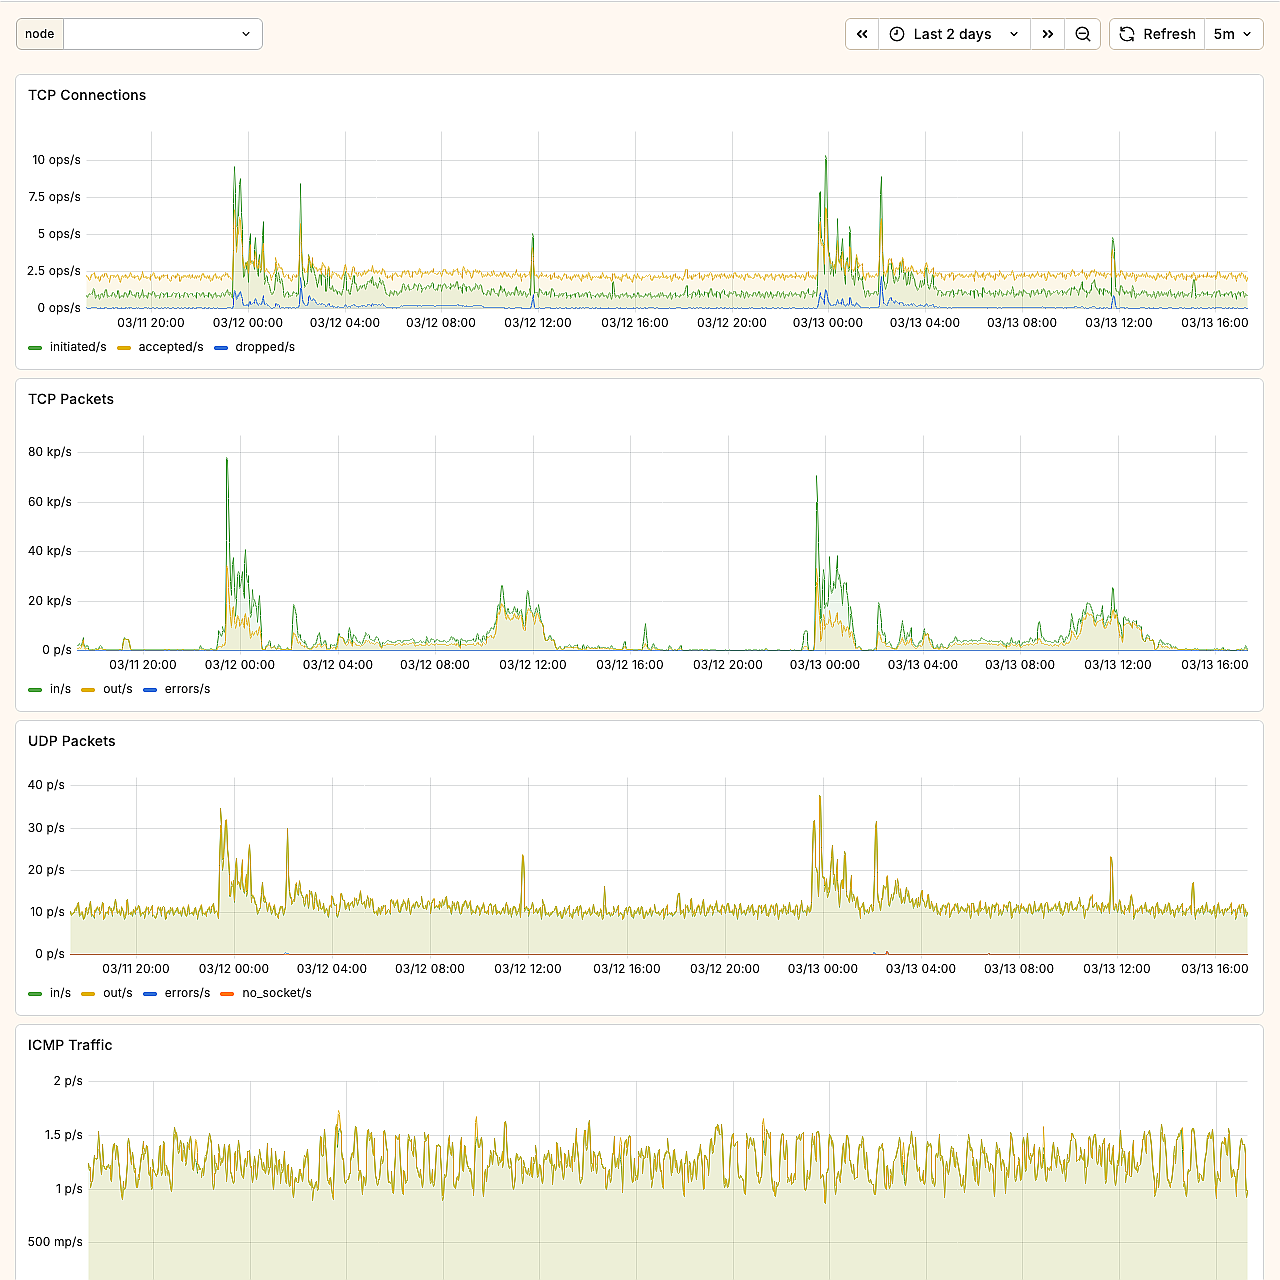
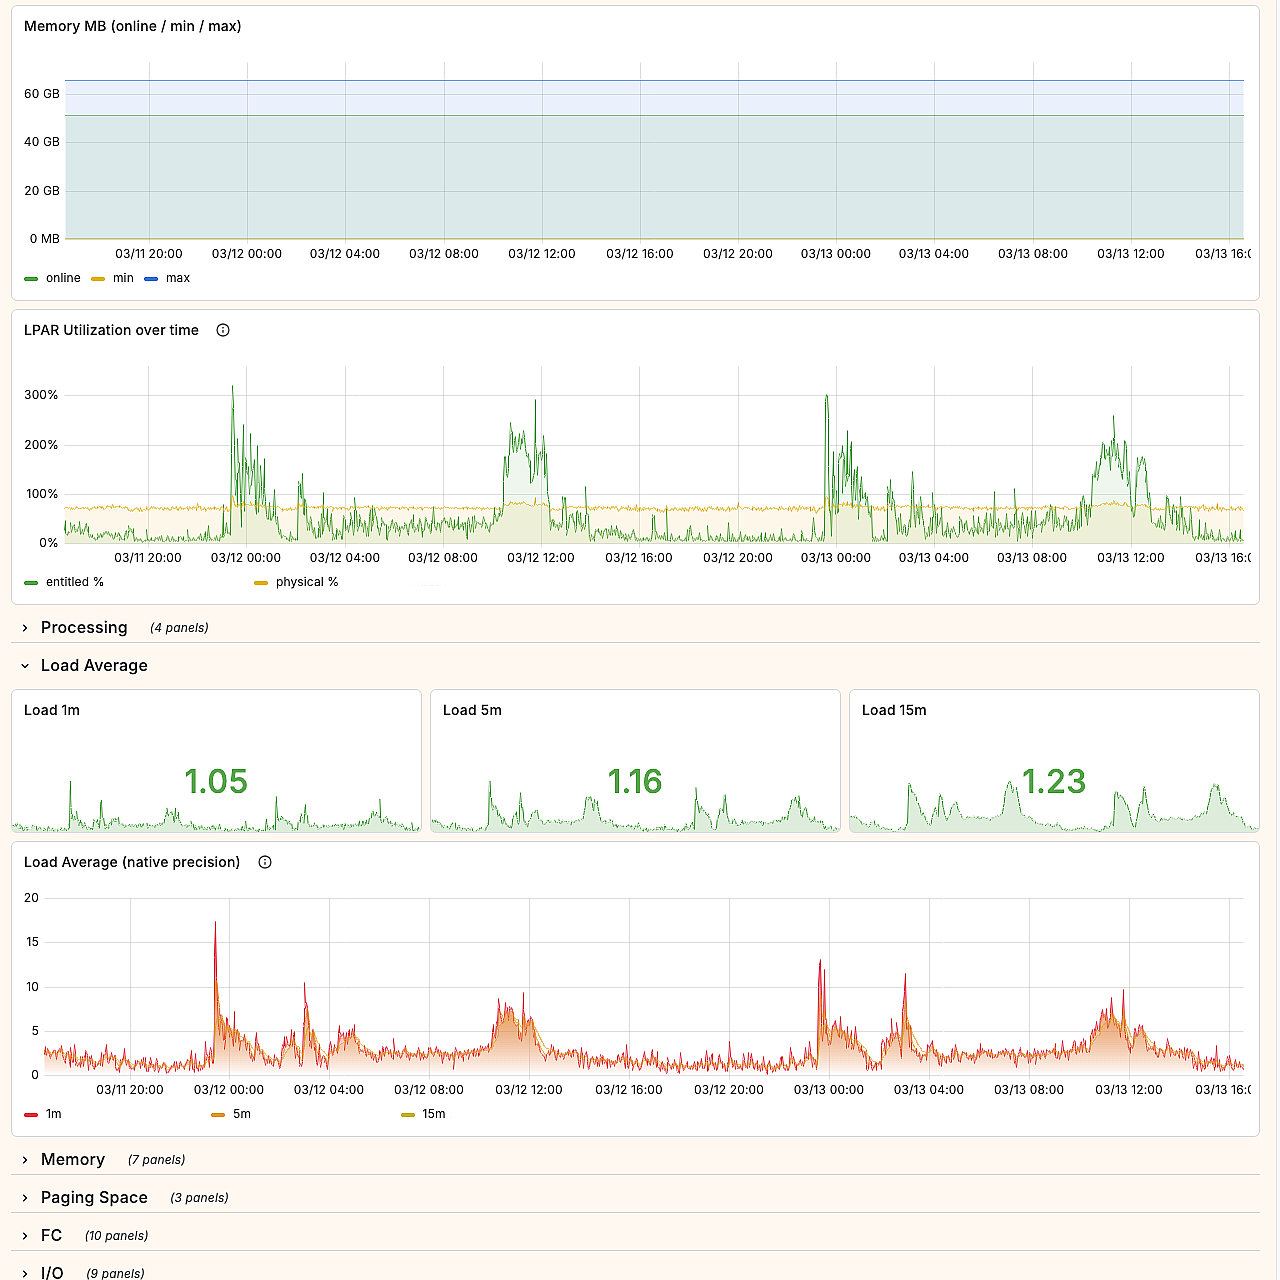
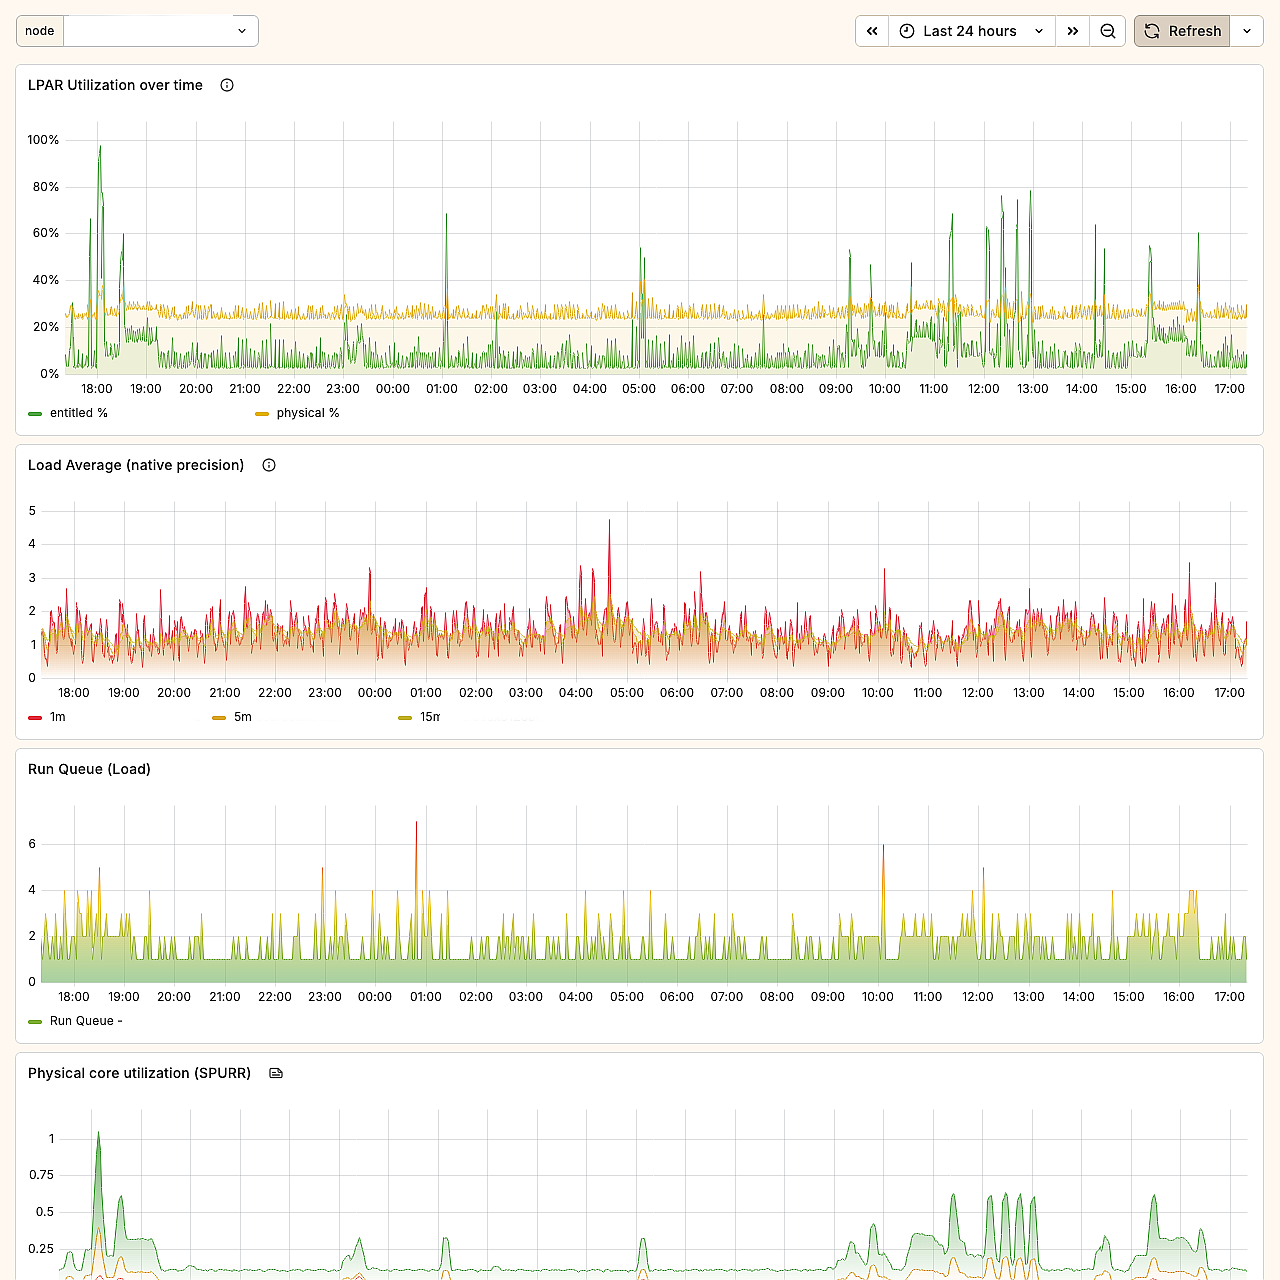
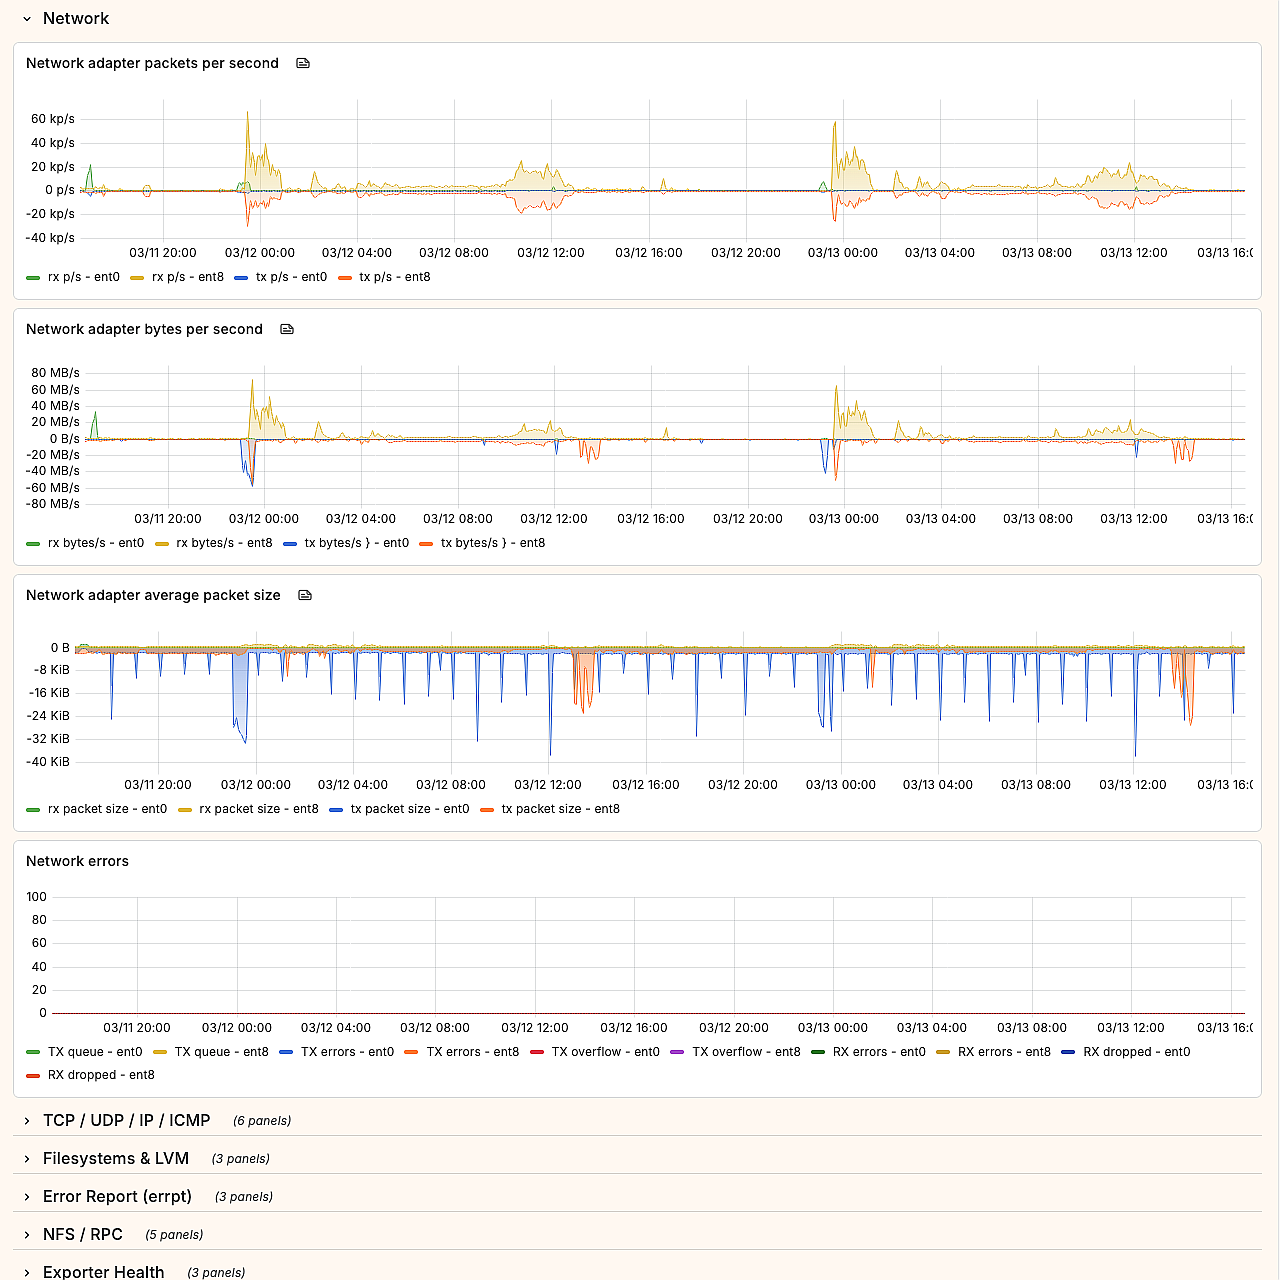
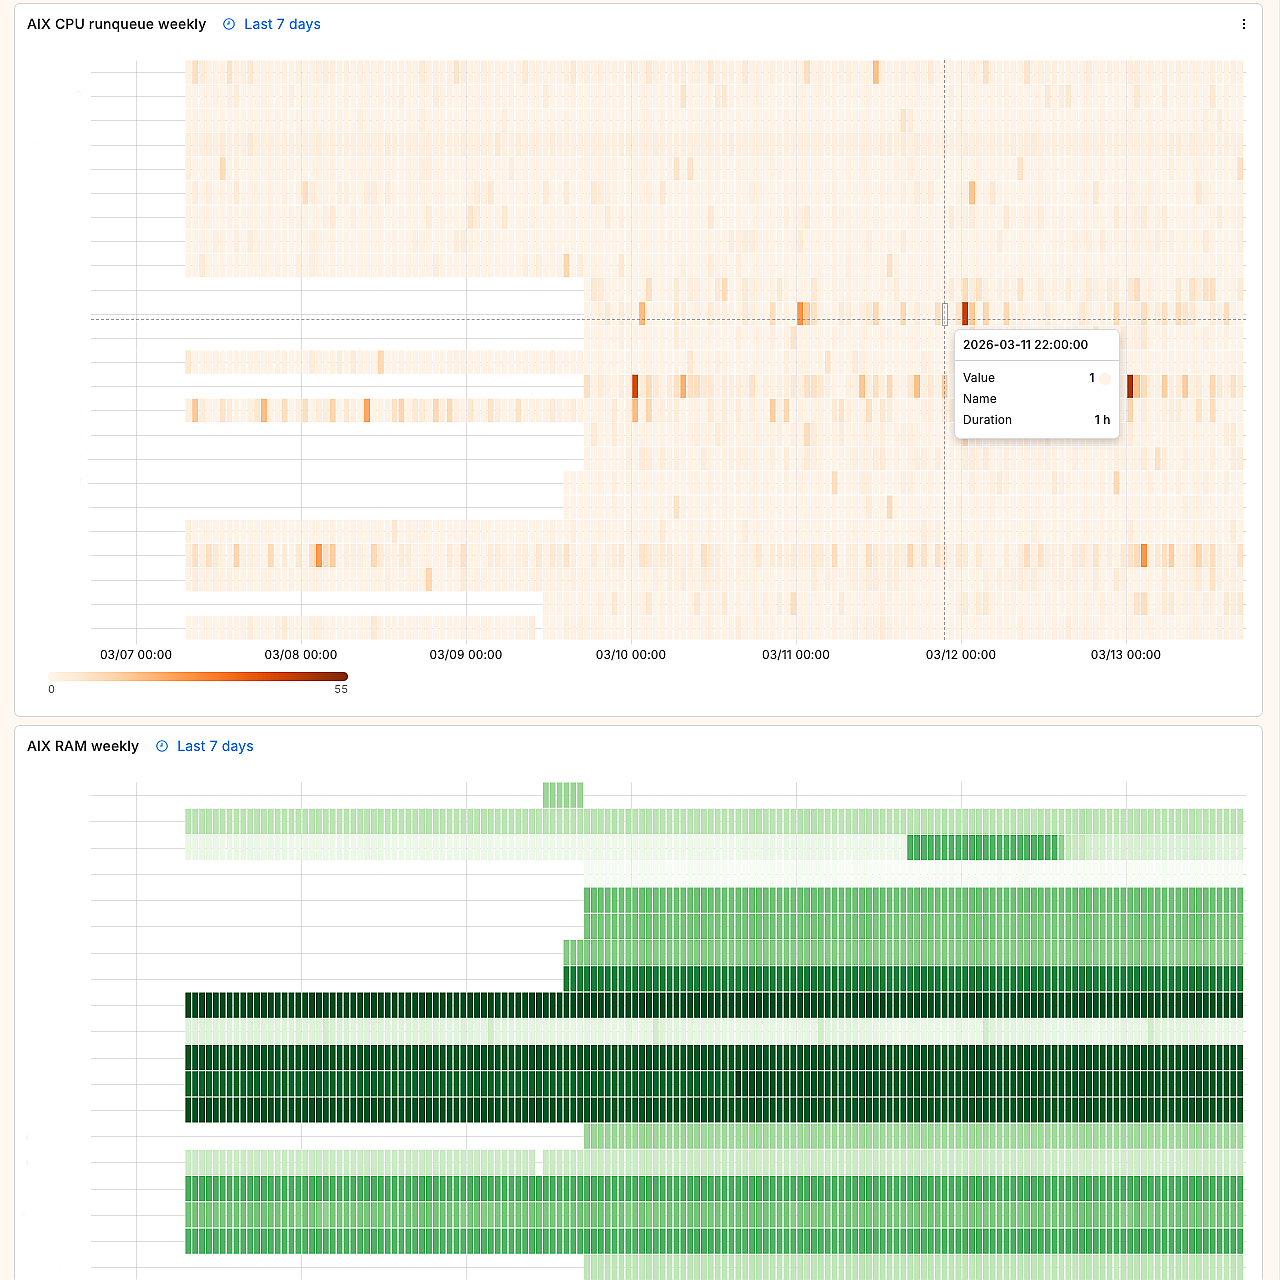
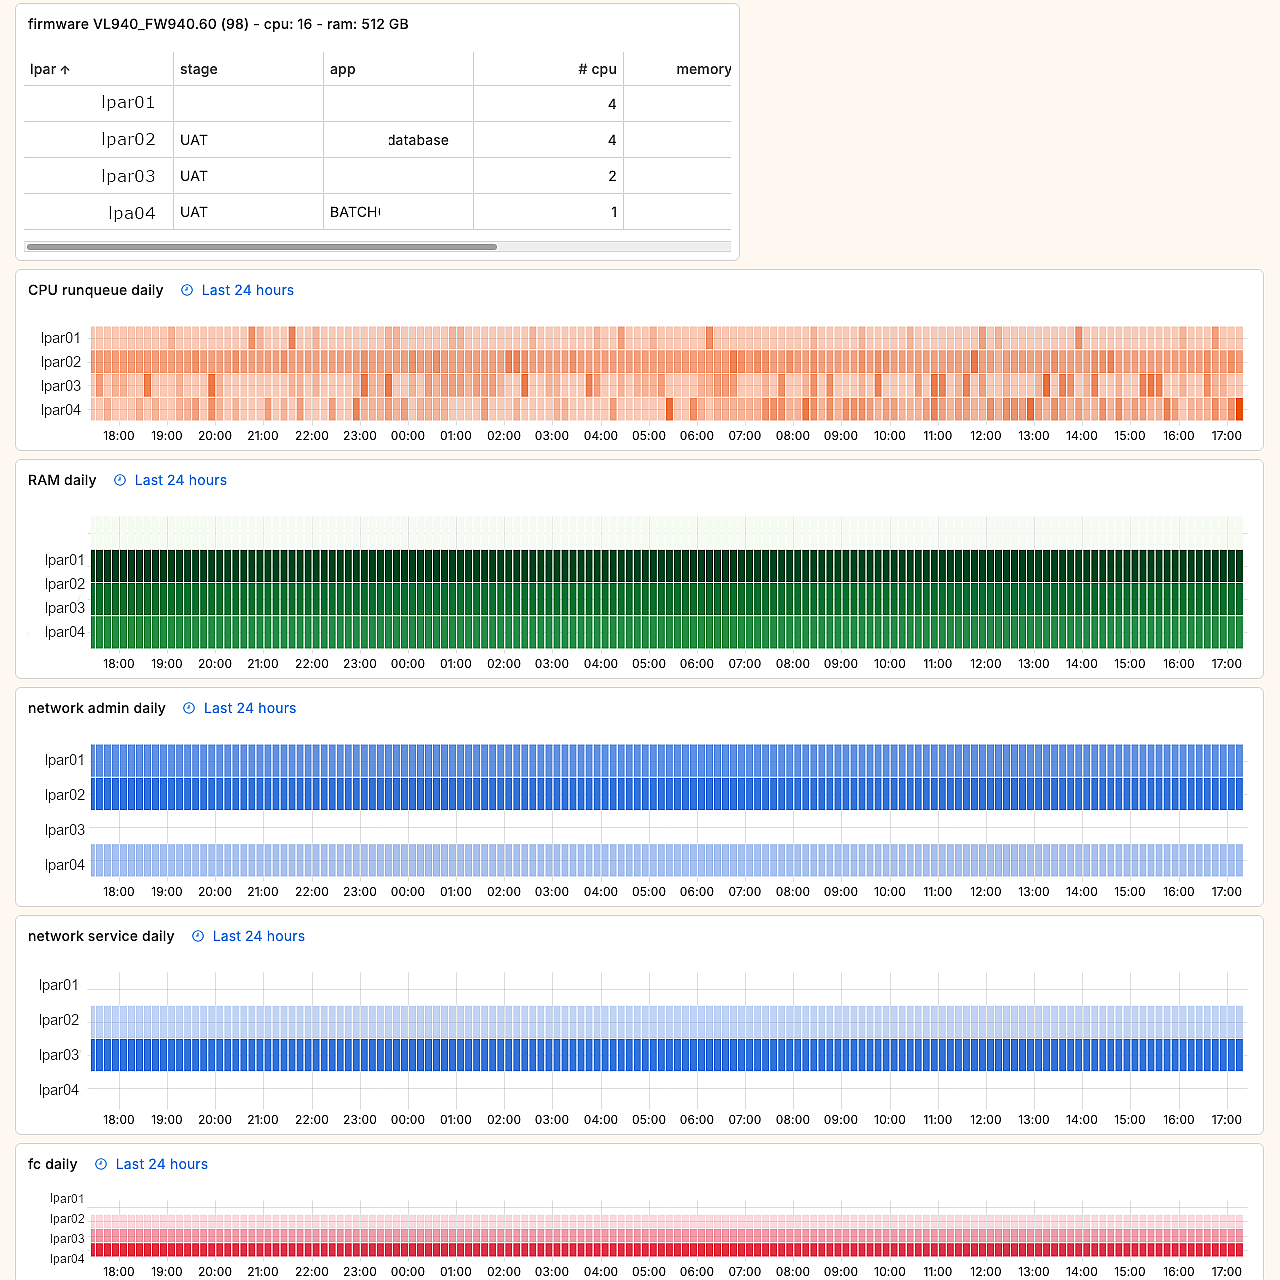
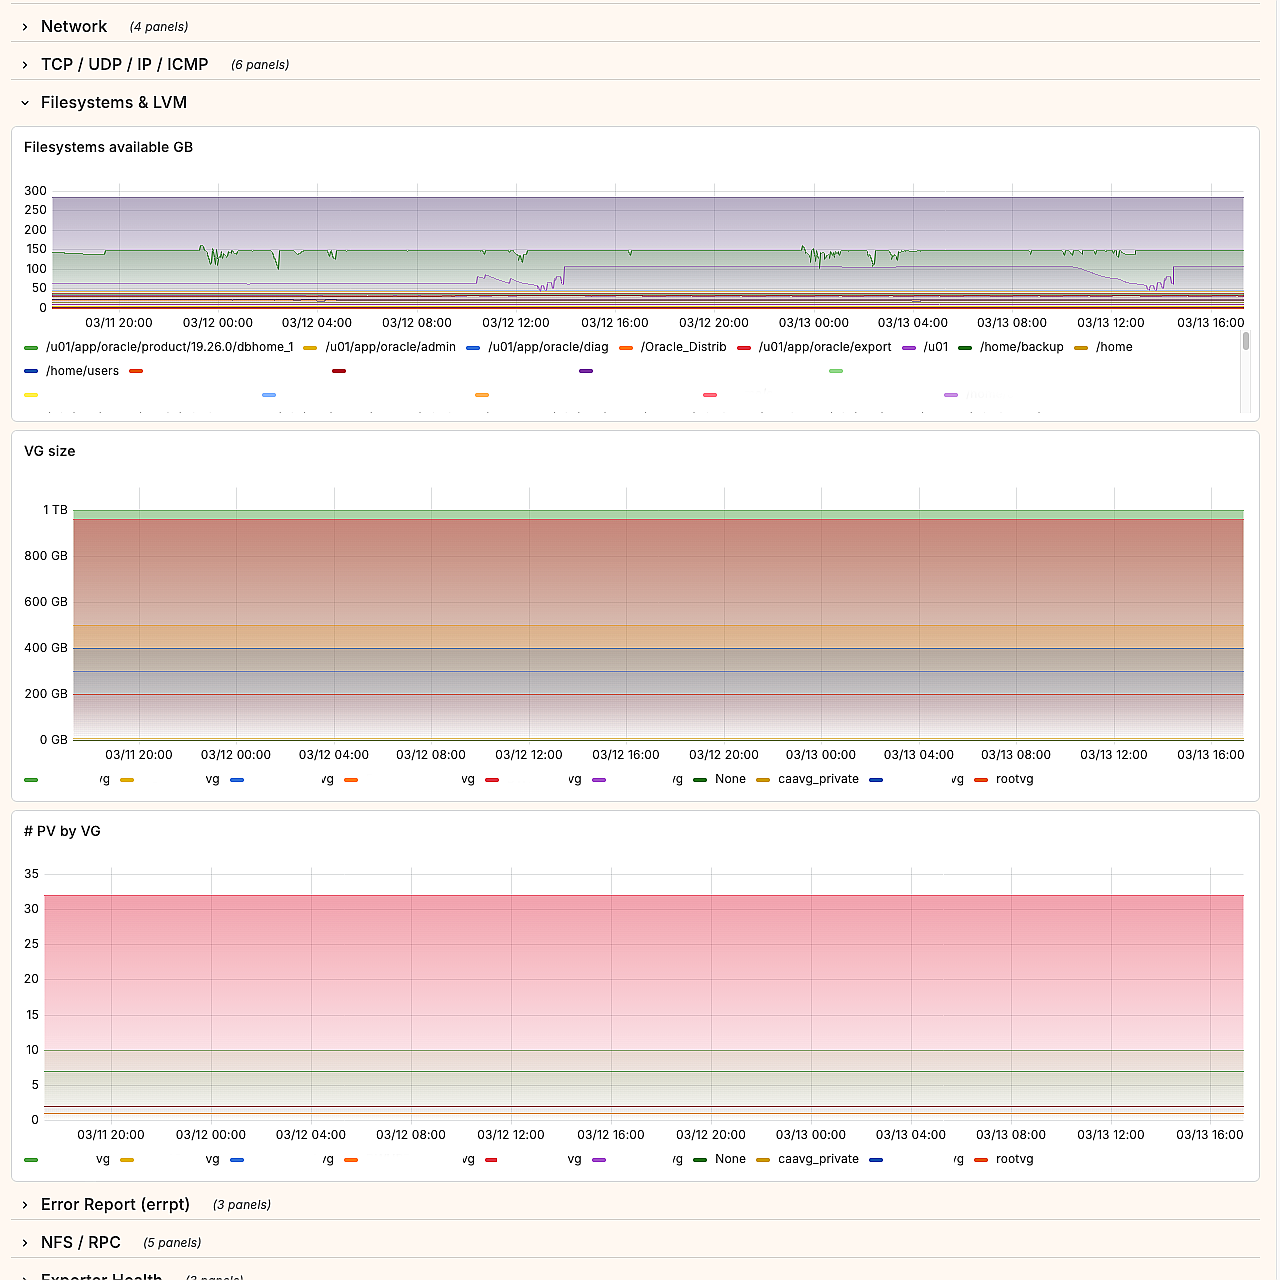
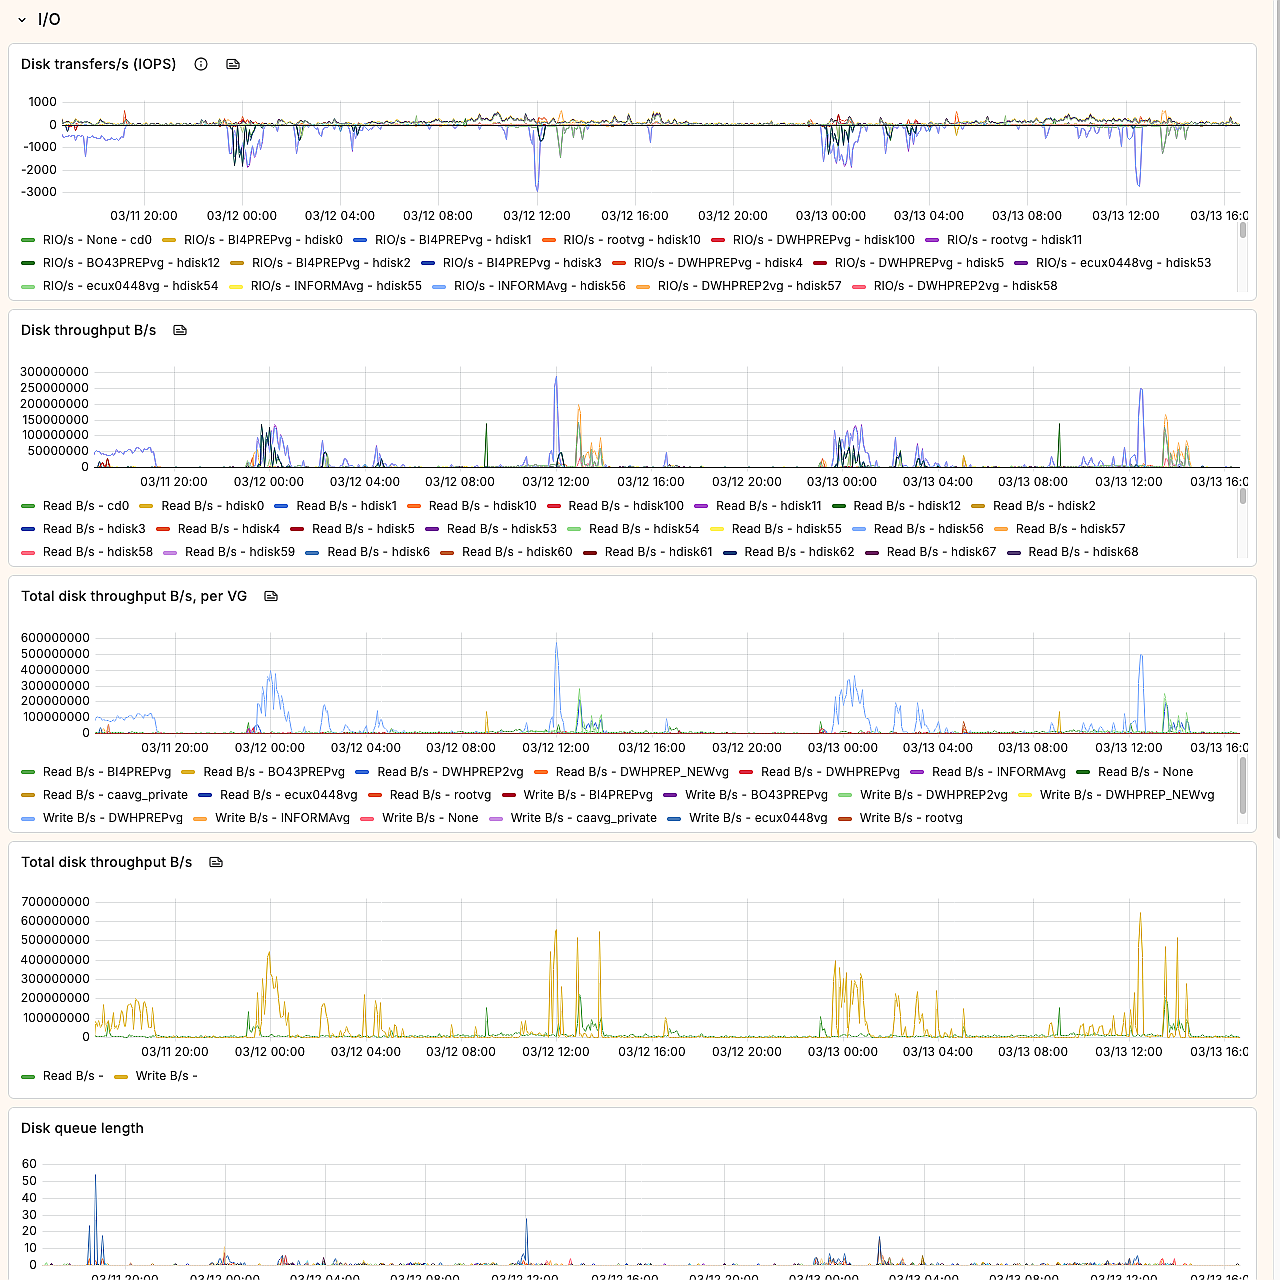
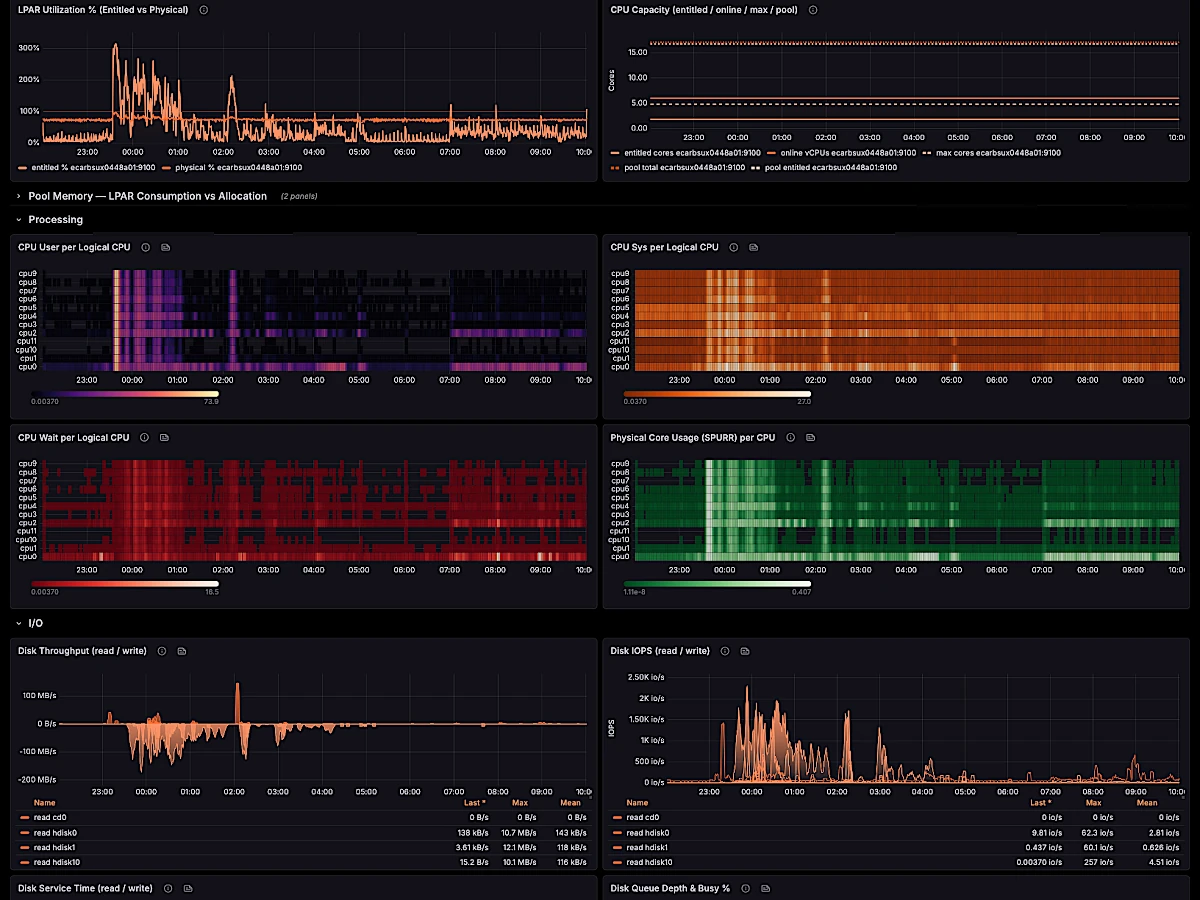
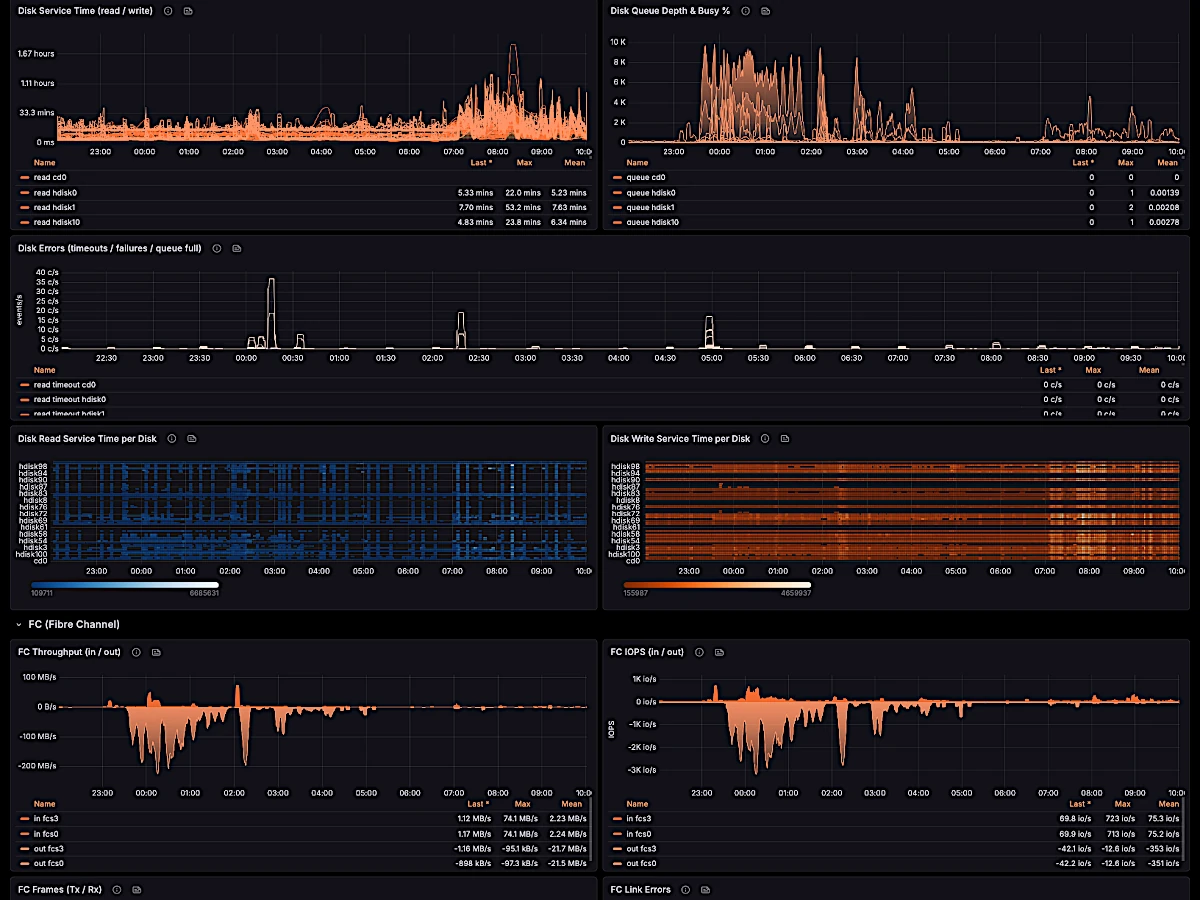
A ready-to-import Grafana dashboard ships with the package. CPU heatmaps, memory trends, disk I/O, FC throughput, error reports, and more — every collector visualized out of the box. Import the JSON, point it at your Prometheus datasource, done.
Use Cases
Capacity planning
Long-term trends for LPAR sizing, memory pressure, and disk growth. Anticipate hardware refresh and right-size capacity before contention bites.
Performance troubleshooting
Drill from CPU or memory spikes to the offending LPAR, the slow disk, or the saturated network adapter — across the entire fleet, in seconds.
Selective monitoring
Enable only the collectors that matter per LPAR. Control cardinality, keep your Prometheus storage budget tight, avoid alert noise from metrics you never query.
Cross-system view
Pair AIX_exporter metrics with Loki Agent errpt streams in the same Grafana — full LPAR health picture, metrics + logs side by side.
Specs & Requirements
| Operating System | IBM AIX 7.1, 7.2, 7.3 |
| Architecture | IBM Power Systems (POWER7 and later) |
| Disk space | < 2 MB |
| Memory | < 5 MB RSS |
| CPU overhead | < 1% (single-threaded, event-driven) |
| Dependencies | GCC runtime libraries (gcc-libs) — install via dnf install gcc-libs |
| Network | One TCP port (default 9100) for Prometheus scraping |
| Prometheus | 2.x or 3.x (OpenMetrics compatible) |
| Grafana | 9.x, 10.x, 11.x, 12.x (60-panel dashboard JSON included) |
Deploy on AIX in 5 minutes
Standard AIX BFF package, registered as an SRC subsystem with auto-start. Install with installp, manage with startsrc/stopsrc. All configuration in a single file at /etc/aix-exporter/aix-exporter.conf.
# 1. Install the BFF package
installp -aXcd /path/to/aix-exporter.1.0.0.2.bff aix-exporter.rte

# 2. (Optional) Edit configuration
vi /etc/aix-exporter/aix-exporter.conf

# 3. Start the exporter
startsrc -s aix-exporter

# 4. Verify metrics are available
curl http://localhost:9100/metrics
That’s it. Add the target to your prometheus.yml and import the included Grafana dashboard.
Configuration options
| Feature | Description |
|---|---|
| Configurable TCP port | Listen on any port with -p <port> (default: 9100) |
| Bind address | Restrict to a specific interface with -l <addr> (default: 0.0.0.0) |
| Sampling period | Adjust scrape interval with -s <seconds> (default: 30s) |
| Selective collectors | Enable only the collectors you need via config file — choose from 22 collectors or use all |
| Configuration file | All options in /etc/aix-exporter/aix-exporter.conf — no flags needed |
| Syslog integration | All events logged to syslog (facility local3) — startup, shutdown, timeouts, errors |
| SRC managed | Registered as an AIX SRC subsystem — start/stop with startsrc/stopsrc |
| Auto-start on boot | Inittab entry created automatically — survives reboots |
| Graceful shutdown | Clean signal handling (SIGTERM/SIGINT) with syslog notification |
| Collector timeout protection | Individual collector timeouts prevent one slow collector from blocking all metrics |
| Standard BFF package | Native AIX installp installation — no dependencies, no compilers needed |
Licensing
Annual subscription — €60 per LPAR per year, billed via Stripe. Updates and support are always included. Cancel anytime; your monitoring keeps running to the end of the paid term.
Frequently Asked Questions
Does it work with Prometheus 3.x?
Yes. AIX_exporter fully supports both Prometheus 2.x and 3.x, including the OpenMetrics exposition format with proper Content-Type headers.
Can I select which collectors to enable?
Yes. Use the configuration file to enable only the collectors you need. For example, collectors = cpu, mem, disk, filesystems will only activate those four collectors.
What is the performance impact on my LPAR?
Minimal. AIX_exporter uses less than 1% CPU and under 5 MB of memory. It’s a single-threaded C binary that queries libperfstat — the same kernel interface used by topas and nmon.
How do I update to a new version?
Simply install the new BFF over the existing one: installp -aXYgd /path/to/new-version.bff all. Your configuration file is preserved. The agent restarts automatically.
Is a Grafana dashboard included?
Yes. A production-ready Grafana dashboard with 60+ panels is included — CPU, memory, disk, filesystem, network, FC adapters, load average, and more. Import the JSON file and you’re set.
What’s included in the free trial?
The trial includes CPU, memory, and partition collectors — enough to evaluate the agent on your infrastructure. The full version unlocks all 22 collectors and 600+ metrics. No time limit on the trial.
Can I deploy it with Ansible?
Yes. We provide a ready-to-use Ansible playbook for mass deployment across your AIX fleet. It handles pre-flight checks, version comparison, installation, configuration, and verification.
You may also like…
Related products
-
power-hmc-exporter
From: 45 € / LPAR / yearSelect options This product has multiple variants. The options may be chosen on the product page -