AIX Monitoring
Loki Agent for AIX v1.0.0.8
Native AIX error log forwarder for Grafana Loki – real-time errpt monitoring with 9 structured labels. Requires only gcc-libs, TLS support, BFF packaged. Centralize AIX error logs across your fleet.
AIX Error Log Forwarder for Grafana Loki
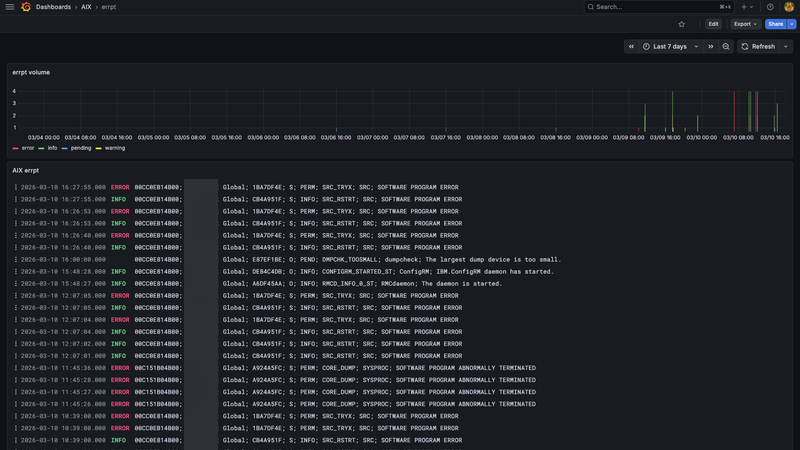
Loki Agent for AIX reads the native AIX error log subsystem events (errlog/errpt) in real-time and forwards structured entries to Grafana Loki via HTTP or HTTPS. Turn your errpt events into searchable, alertable log streams. Correlate the sequences of multiple errpt events over time and multiple systems and lpars: troubleshoot faster, identify the root causes quicker, gain in agility and reactivity. Installation in one command with installp.
Centralized errpt collection
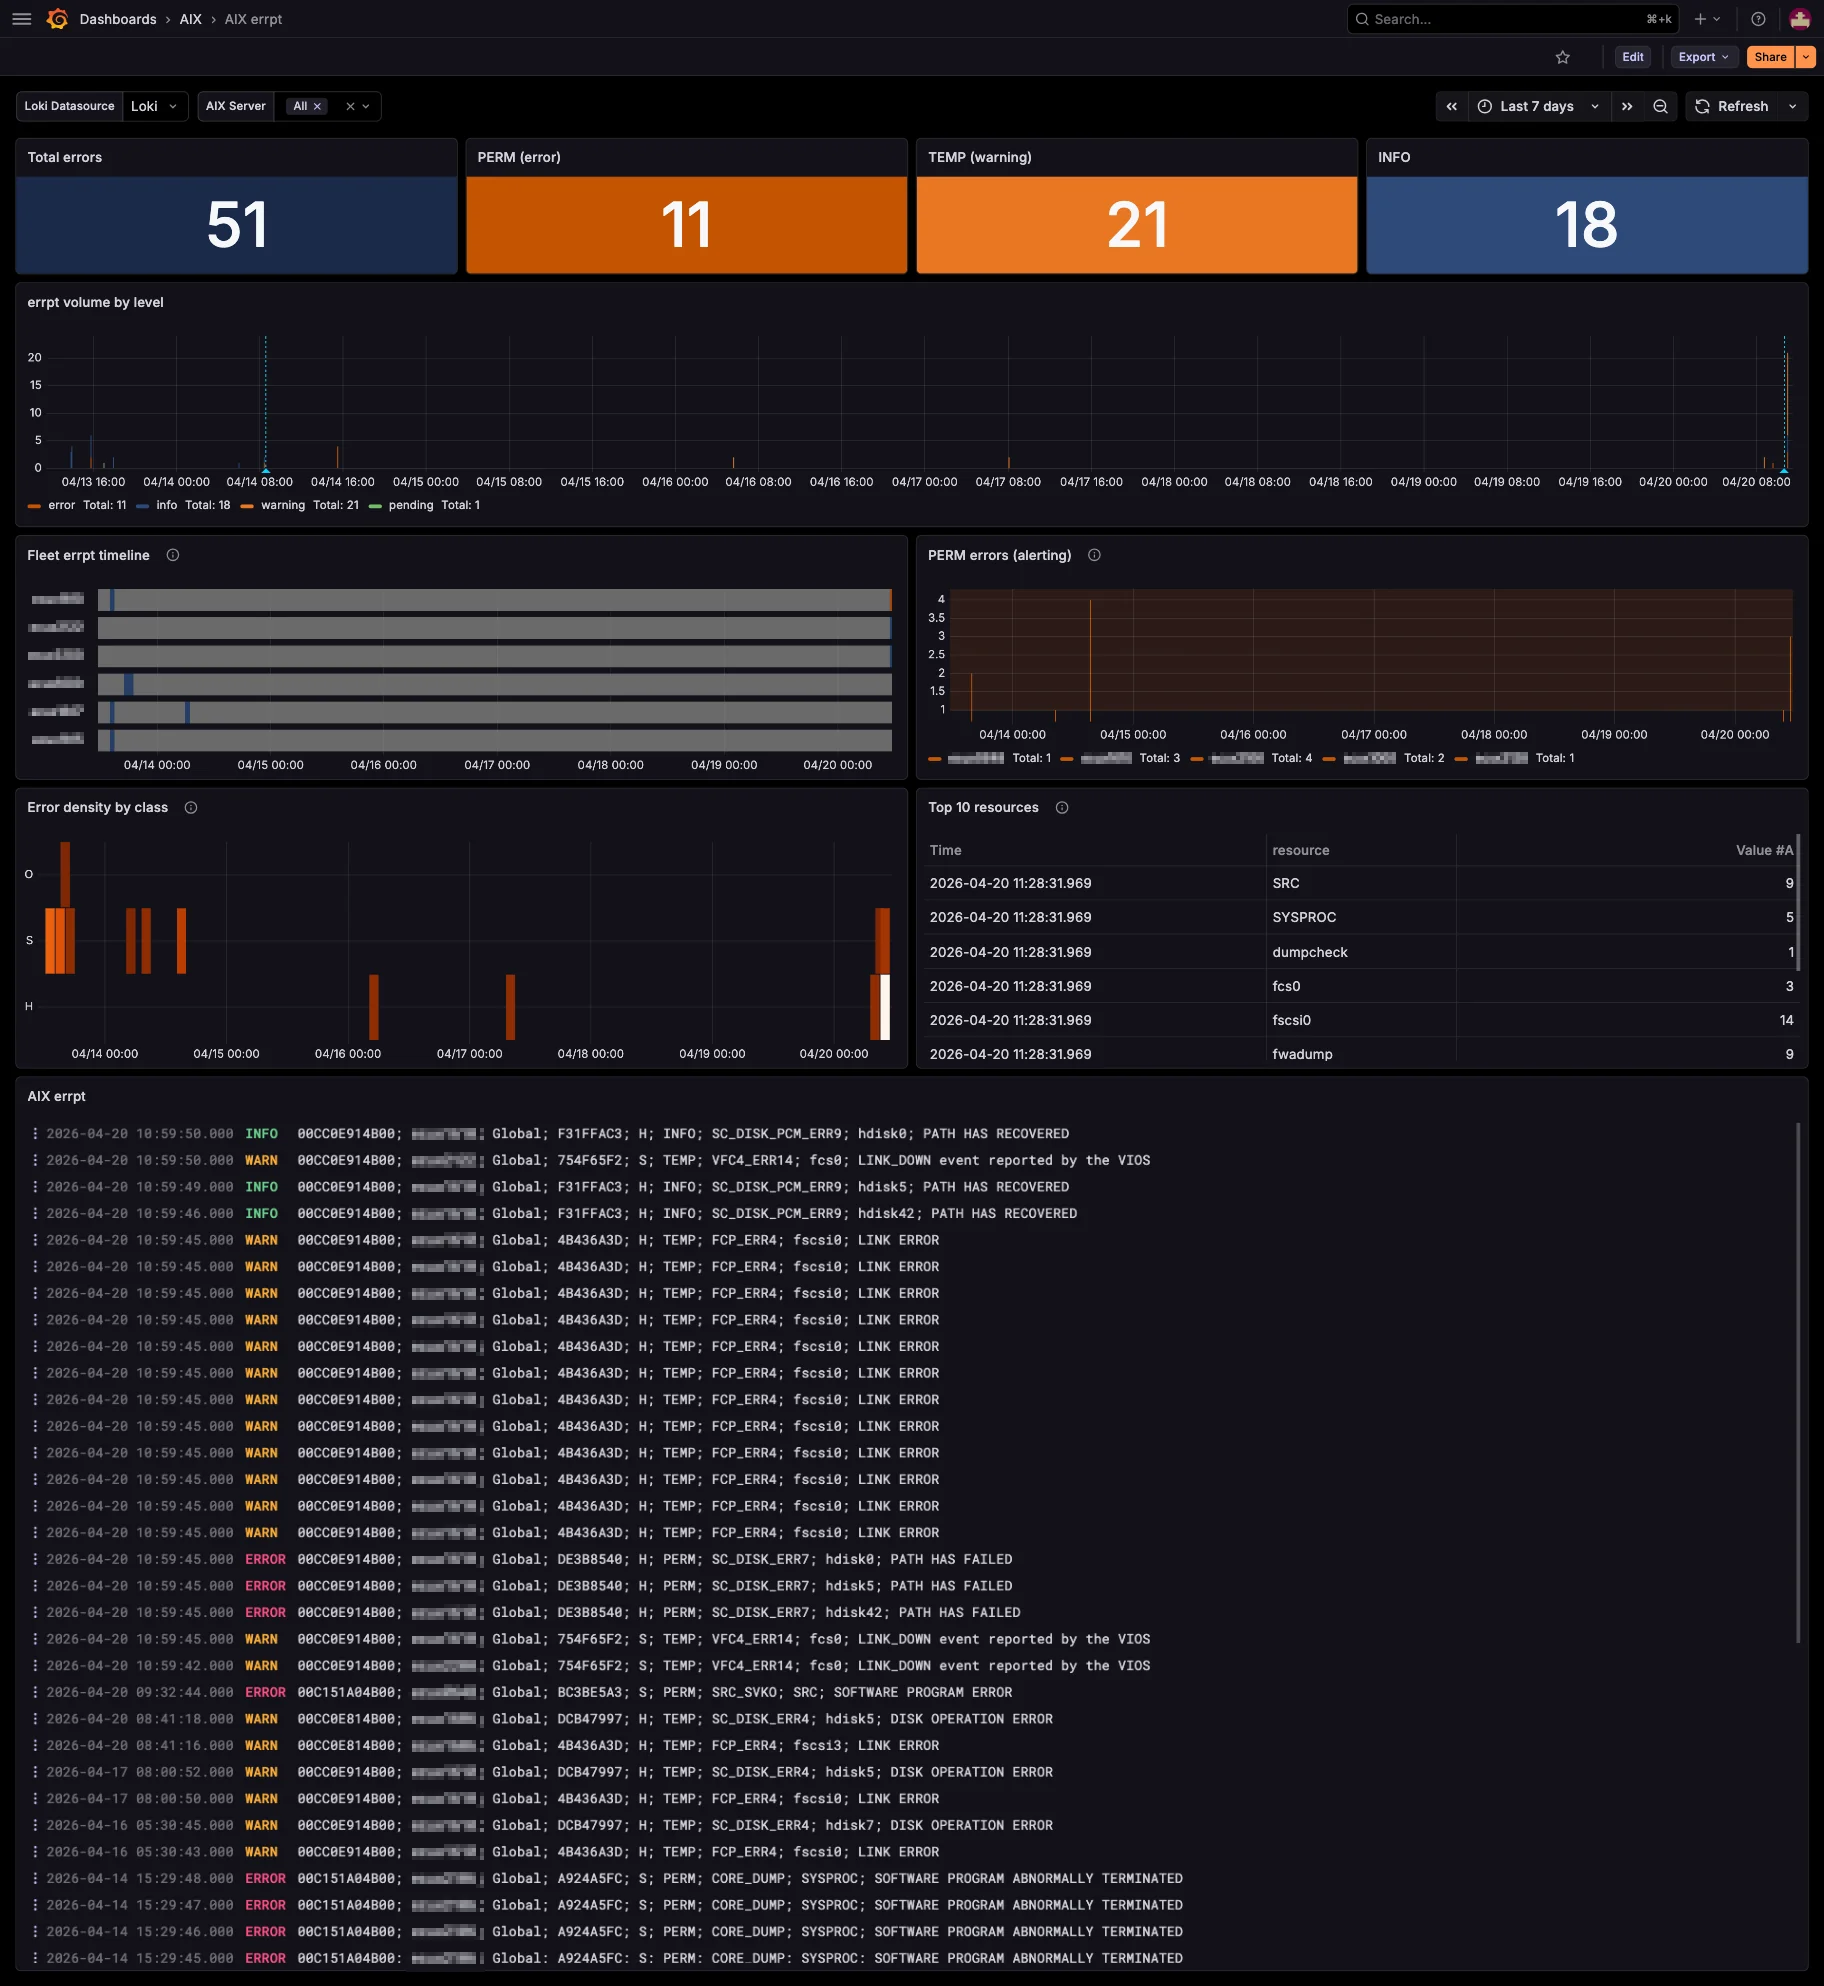
Instantly monitor the health of your entire AIX fleet
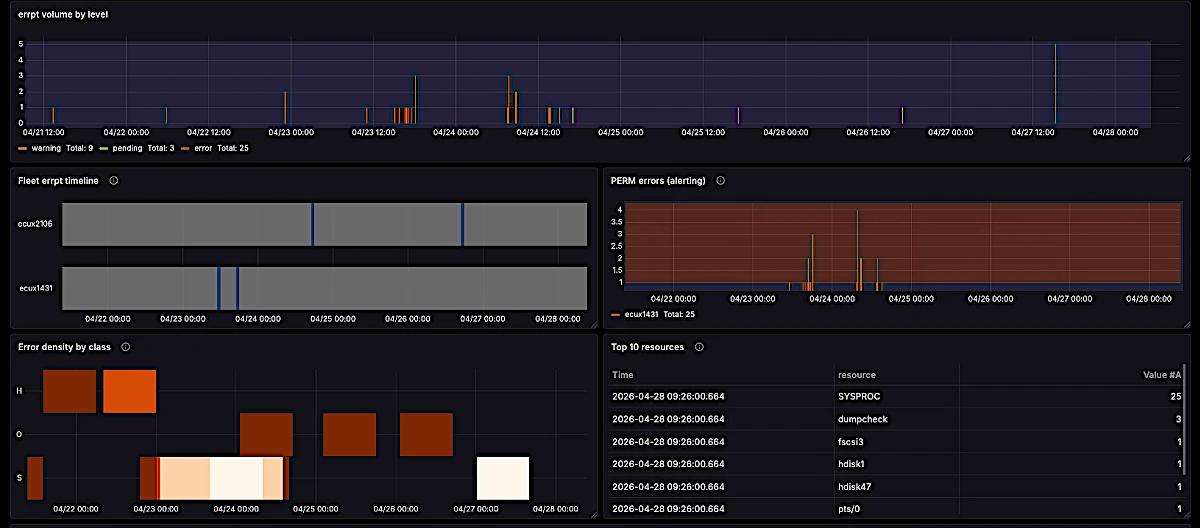
Every LPAR in your AIX fleet streamed live into a single Grafana view. No more SSH-hopping across hosts to chase errpt entries — open one dashboard and see the whole estate at once.
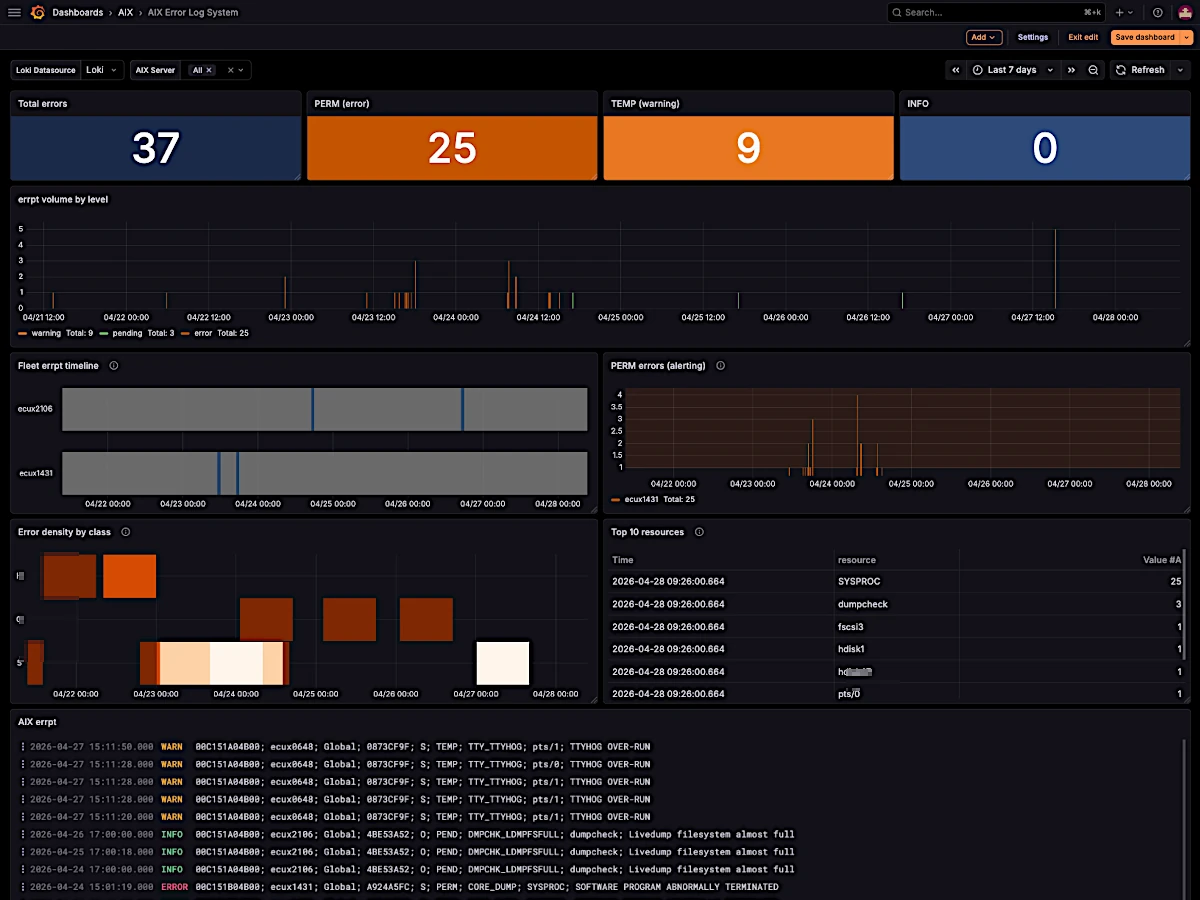
Multi-dimensional filtering
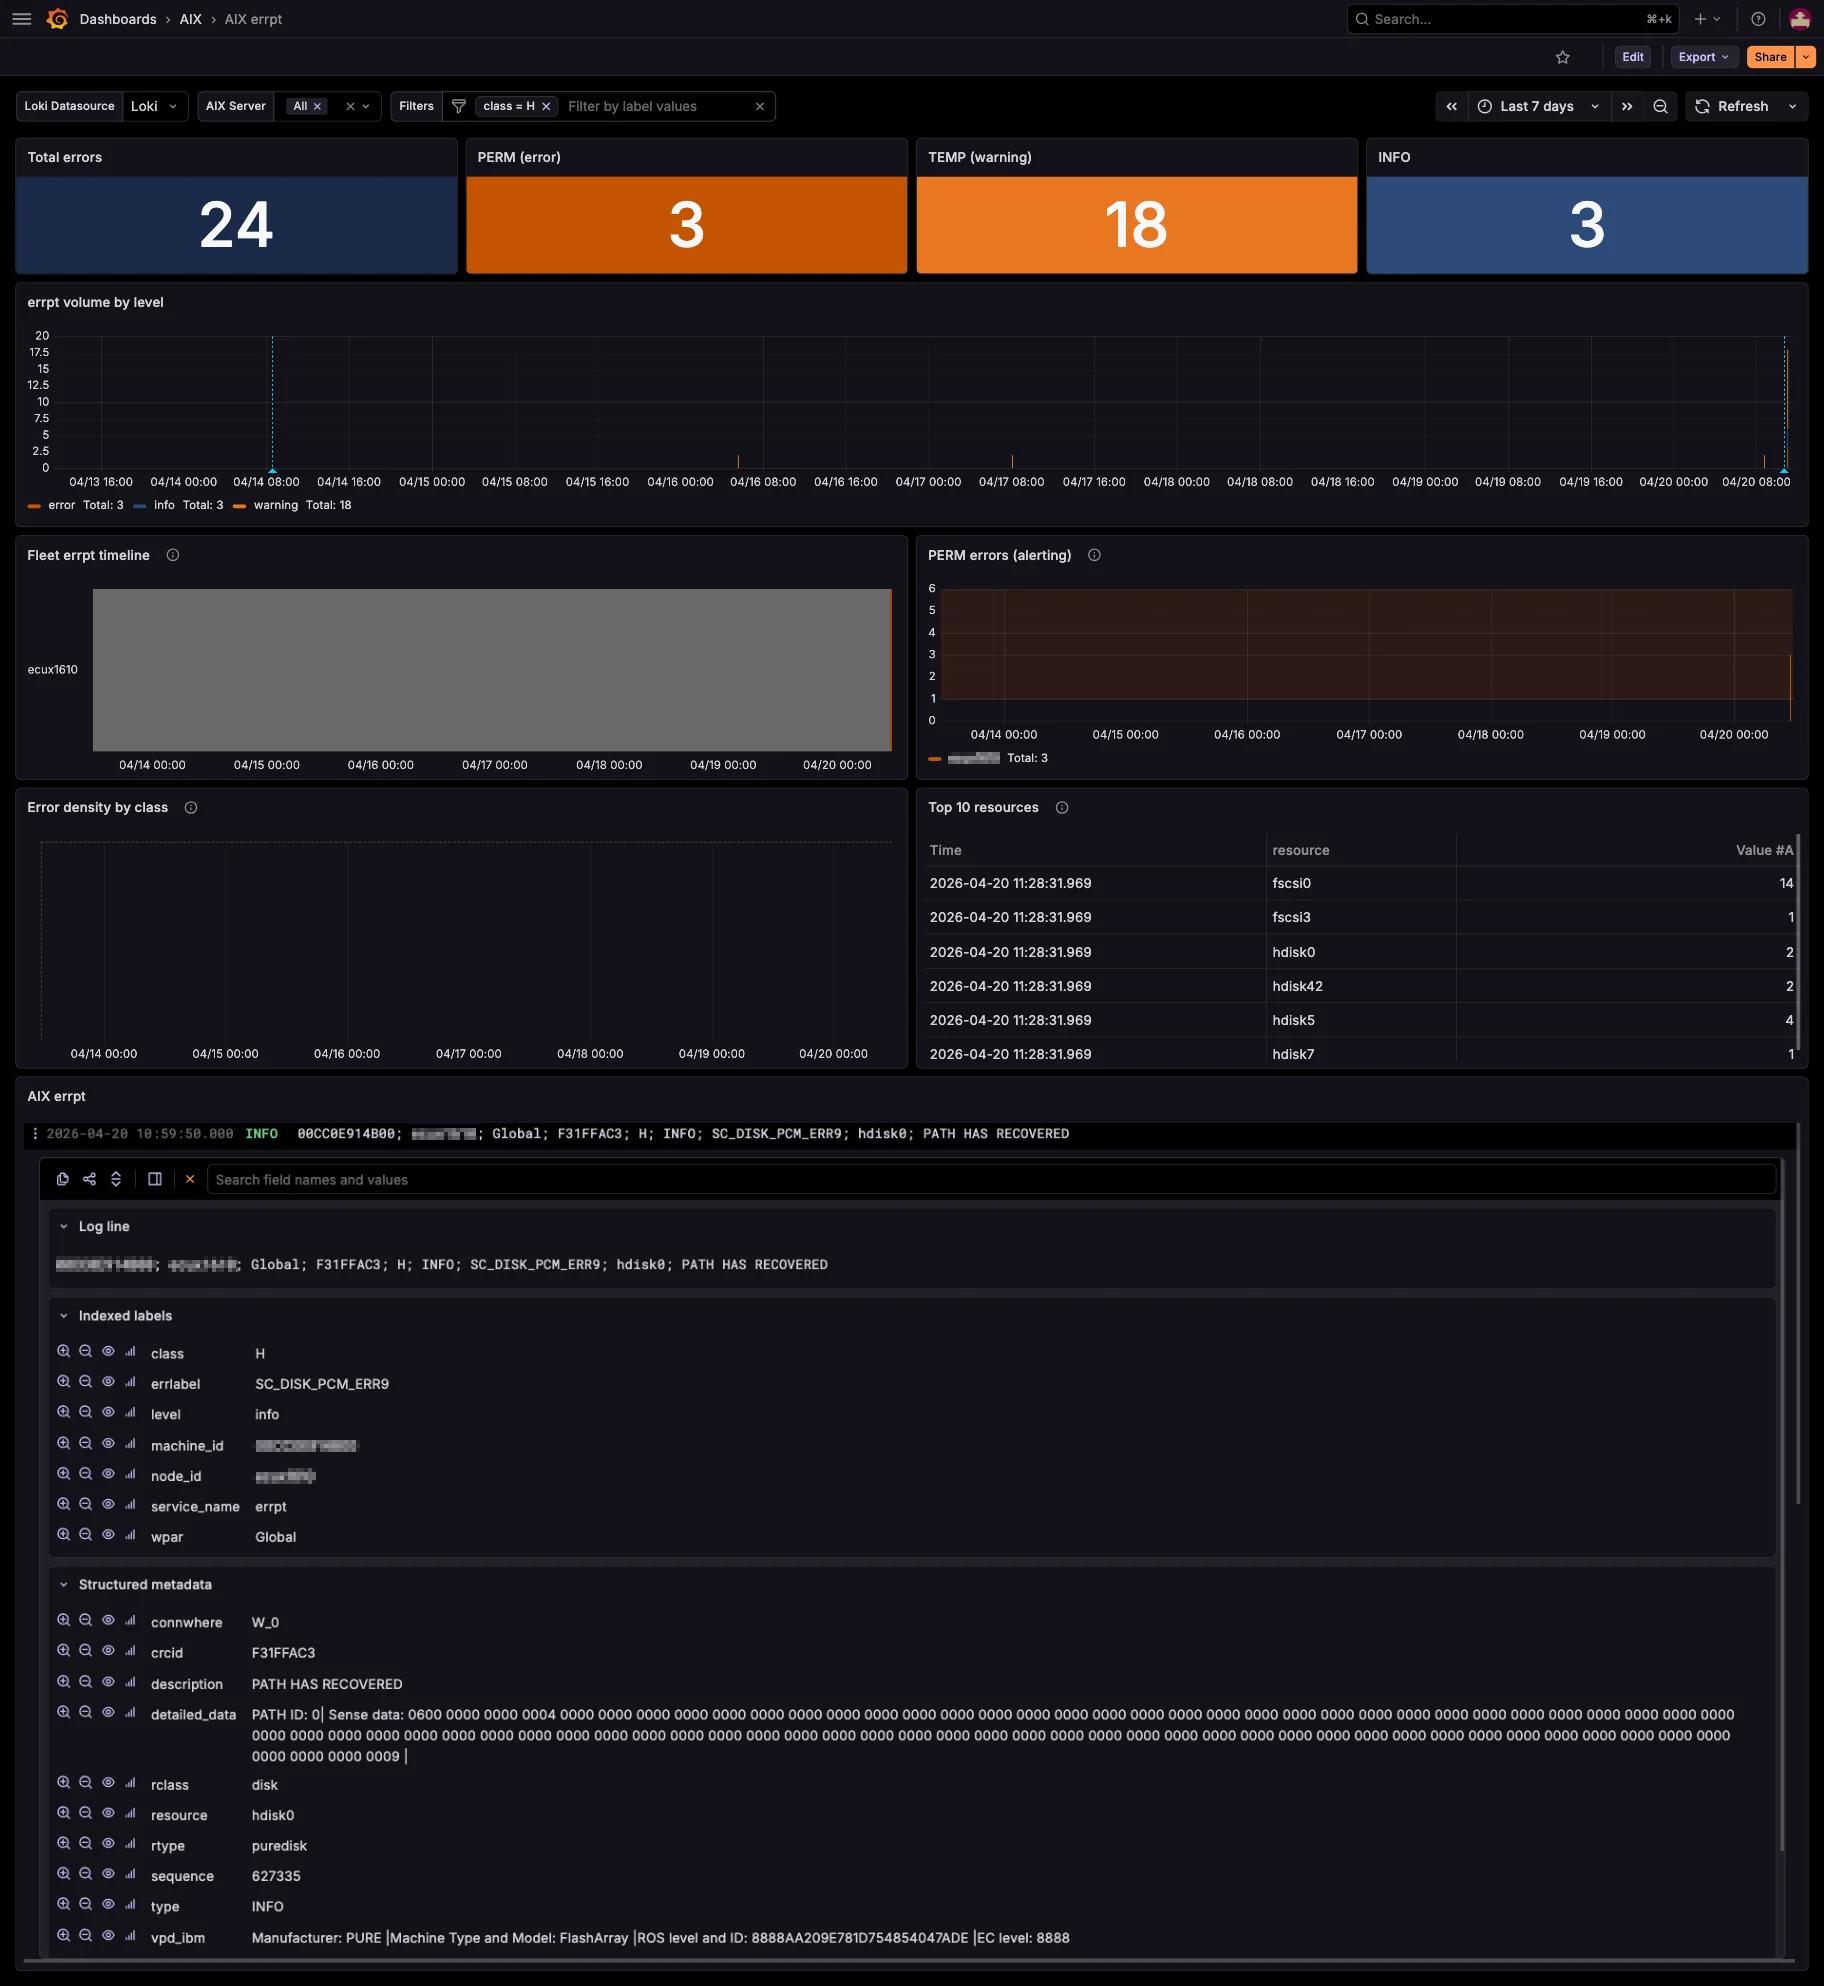
Fine search among thousands of events
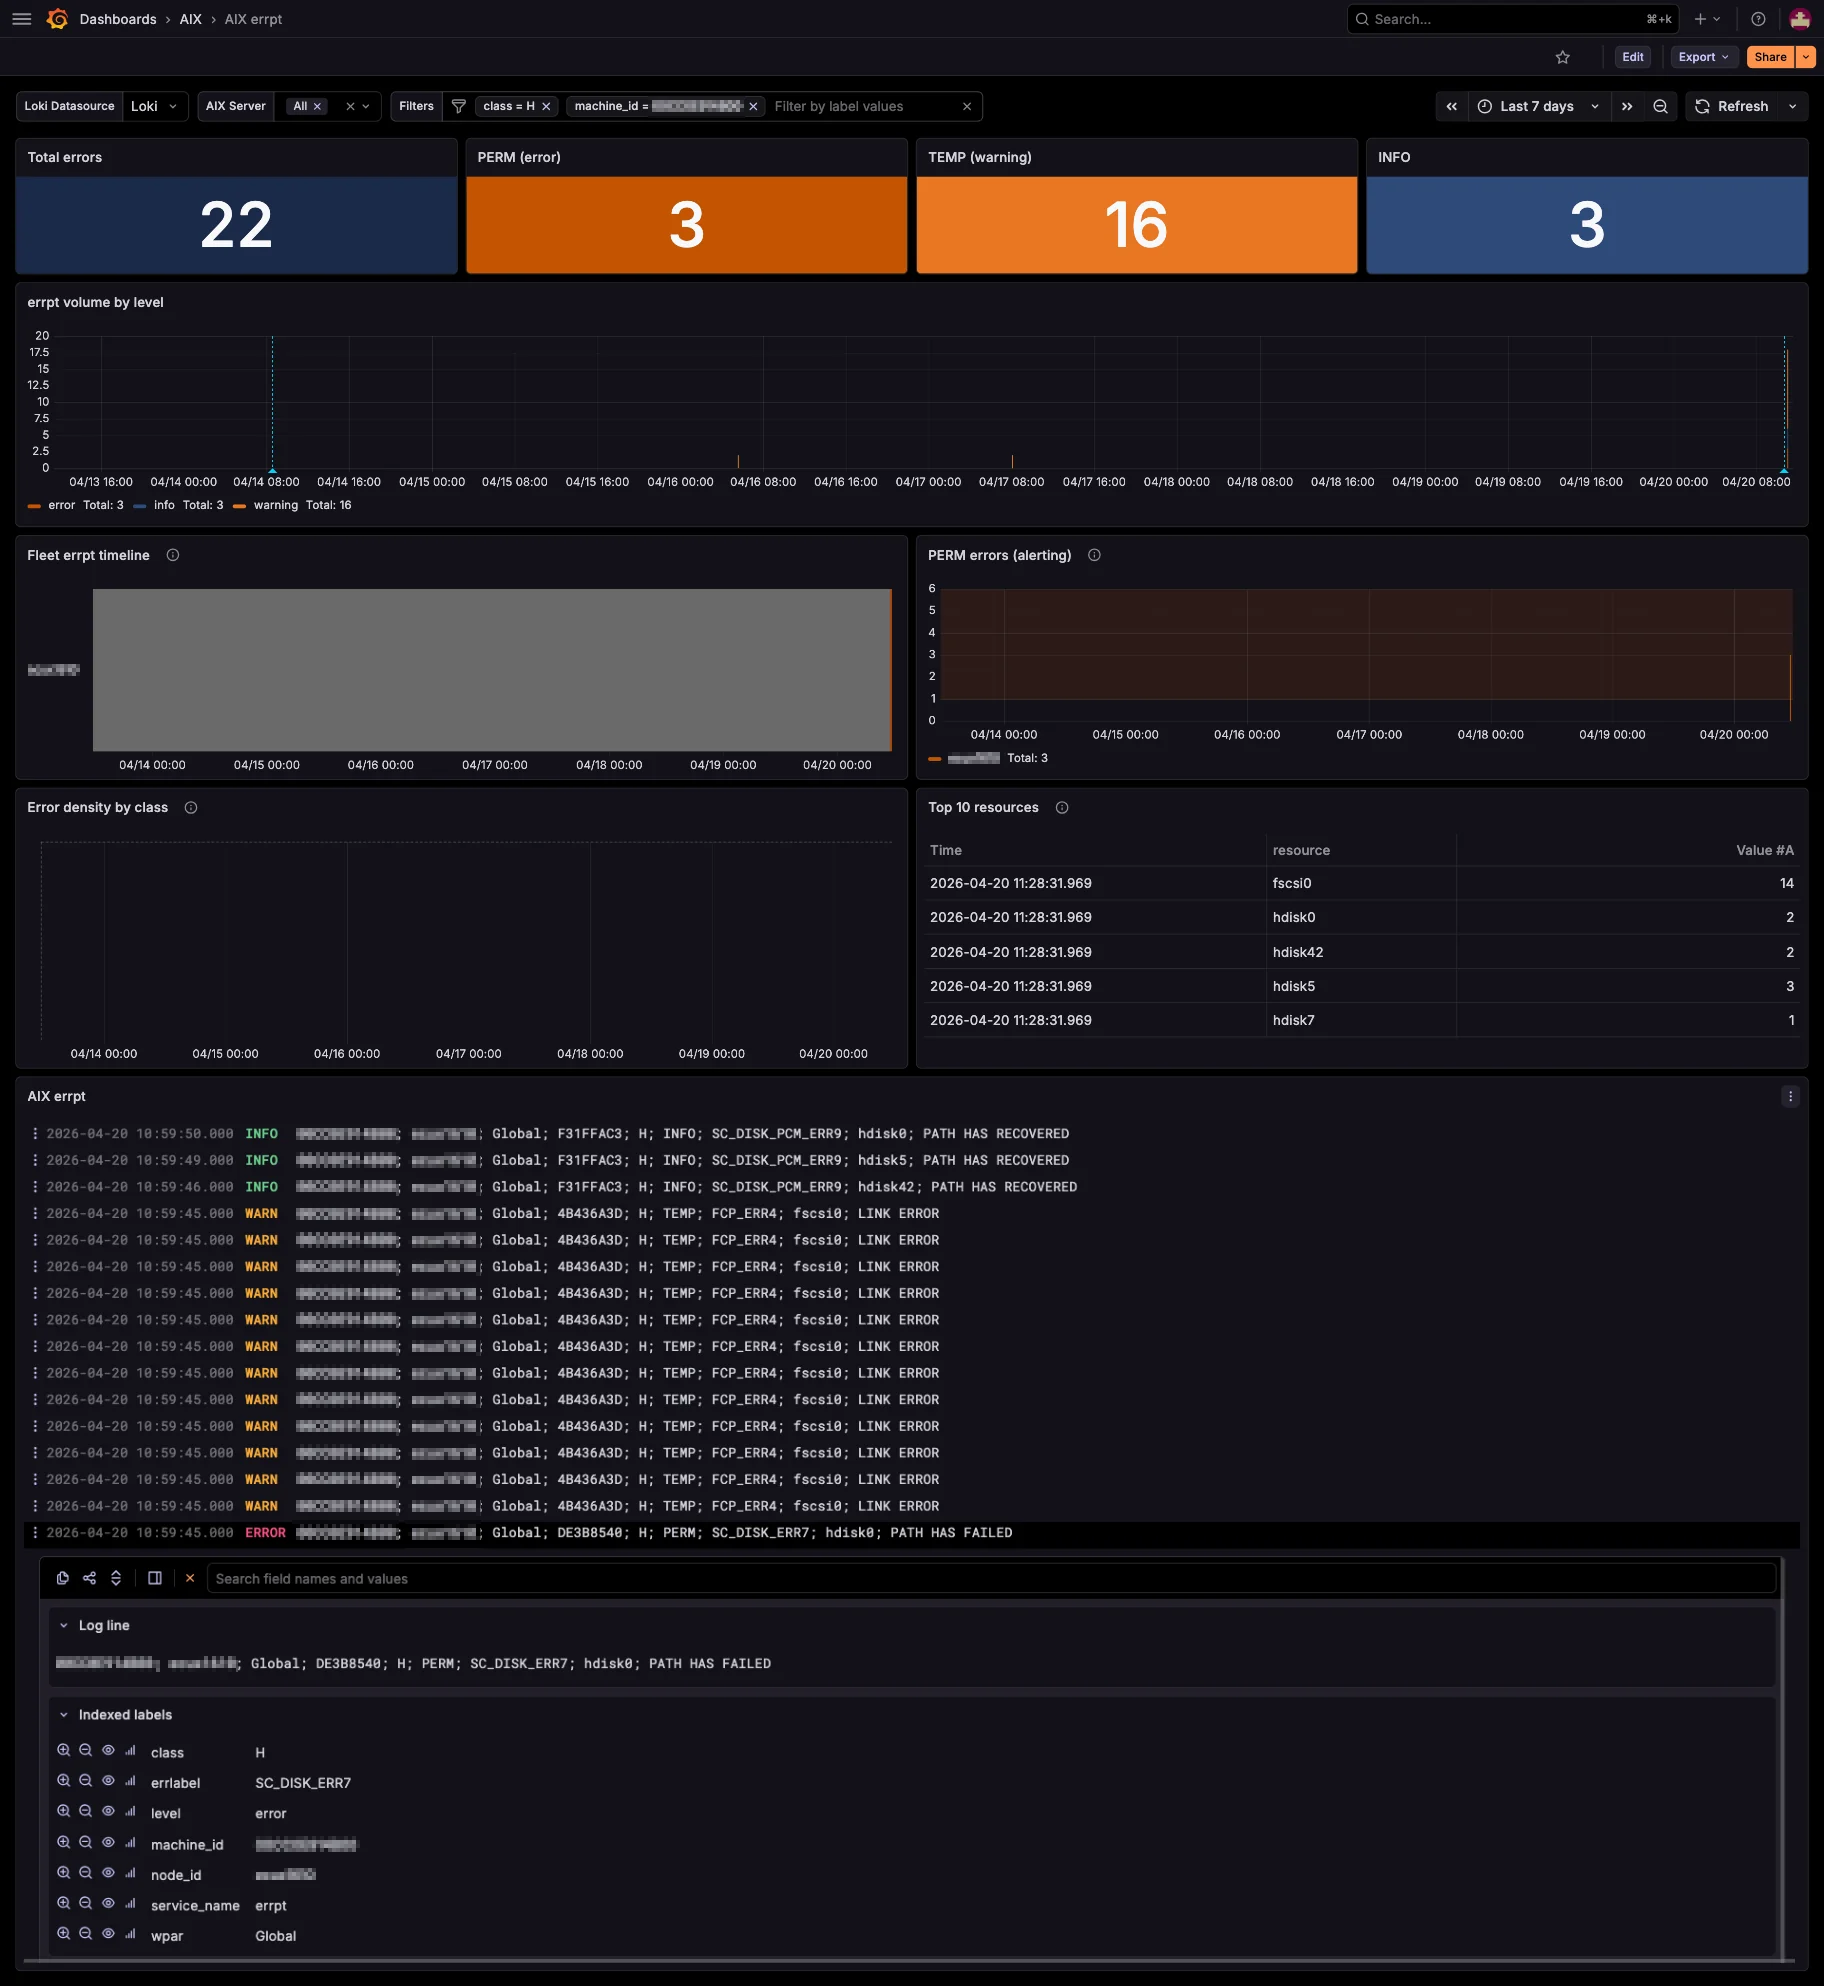
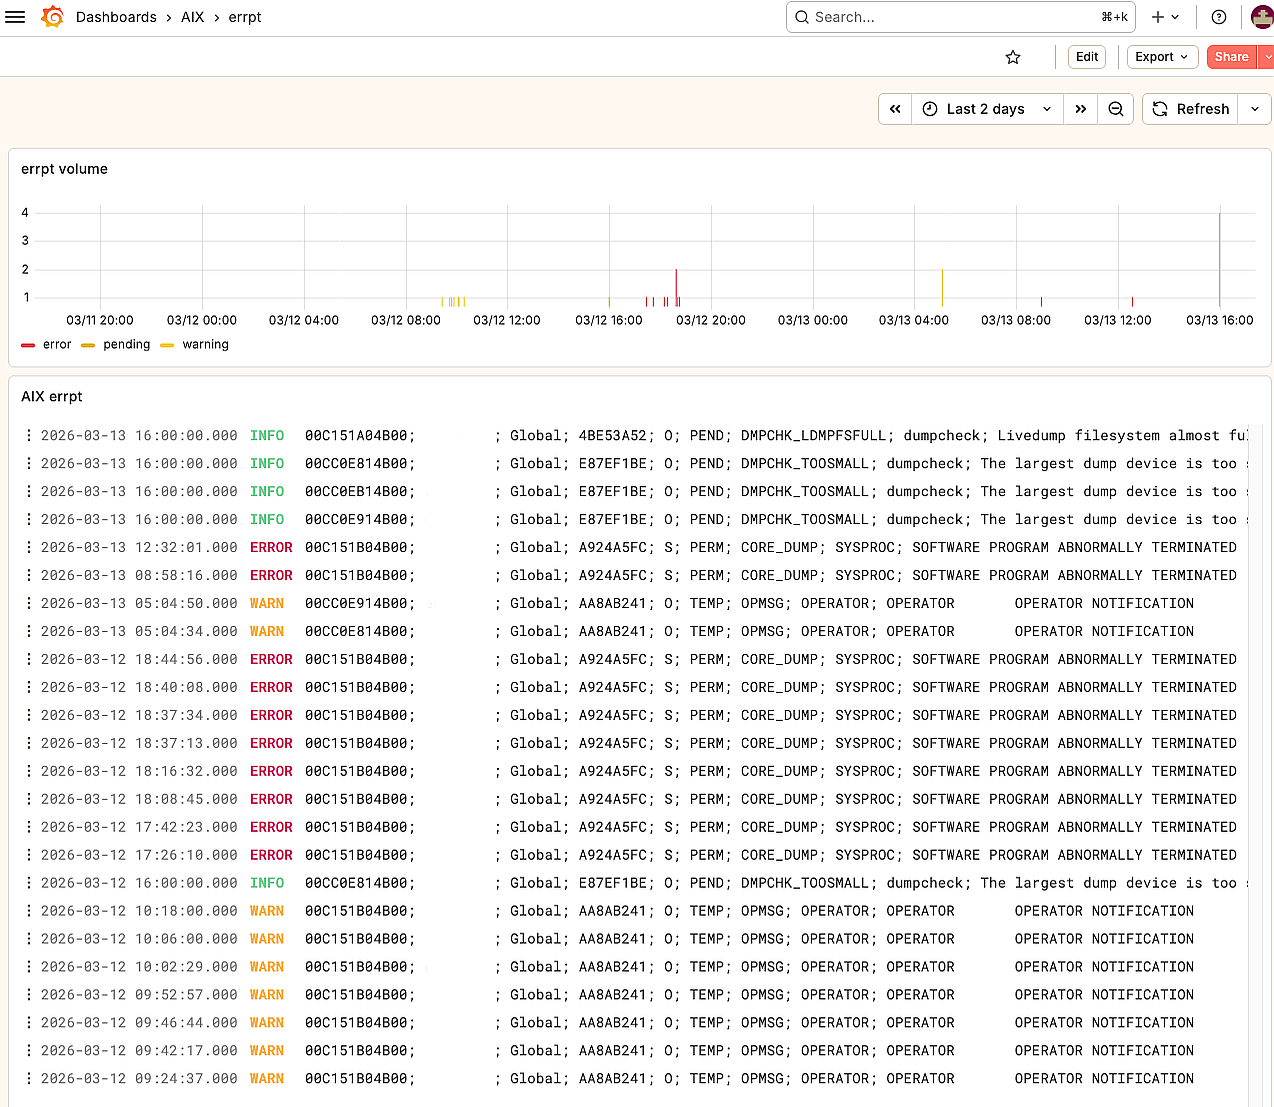
Filter errpt events on any dimension that matters: hostname, machine ID, error class (H/S/O/U), type (PERM/TEMP/PERF/PEND/INFO/UNKN), resource (hdisk*, ent*, SRC, …), template ID, or description text.
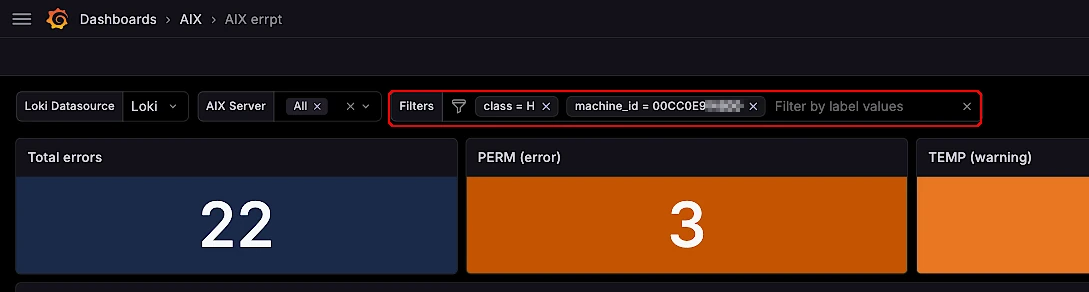
Alert sequence visualization by criticality
Visualize the history of events
Interactive timeline with zoom, acknowledgement, and cross-LPAR correlation, color-coded by severity. Spot the cascade of errors that led to an outage in seconds, instead of stitching it together from raw errpt output.
Syslog compatible
Slot into your existing log stack
Loki Agent runs as a native AIX SRC subsystem with a standard BFF package — no VM, no container, no third-party runtime. Every event is also routed to local syslog, so it plugs into rsyslog, syslog-ng, or any forwarder you already run with zero rework.
Apr 26 09:15:42 aix-prod-01 daemon:notice loki-agent[2851232]: forwarded errpt entry crcid=4B436A3D class=H type=PERM resource=hdisk5
Apr 26 09:15:43 aix-prod-01 daemon:info   loki-agent[2851232]: push to loki ok (1 entry, 312 bytes)
Apr 26 09:15:51 aix-prod-01 daemon:notice loki-agent[2851232]: forwarded errpt entry crcid=754F65F2 class=S type=TEMP resource=fcs0
Apr 26 09:15:51 aix-prod-01 daemon:info   loki-agent[2851232]: push to loki ok (1 entry, 298 bytes)
Apr 26 09:16:03 aix-prod-01 daemon:notice loki-agent[2851232]: forwarded errpt entry crcid=F31FFAC3 class=H type=INFO resource=hdisk0
Apr 26 09:16:03 aix-prod-01 daemon:info   loki-agent[2851232]: push to loki ok (1 entry, 305 bytes)
Apr 26 09:16:18 aix-prod-01 daemon:warn   loki-agent[2851232]: loki unreachable, retry in 5s
Apr 26 09:16:23 aix-prod-01 daemon:info   loki-agent[2851232]: loki reconnected, resuming forward
Workflow
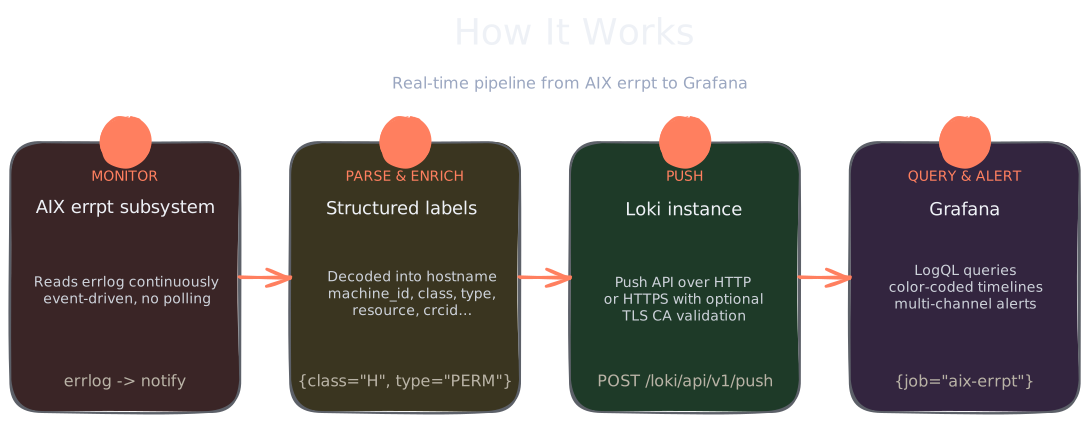
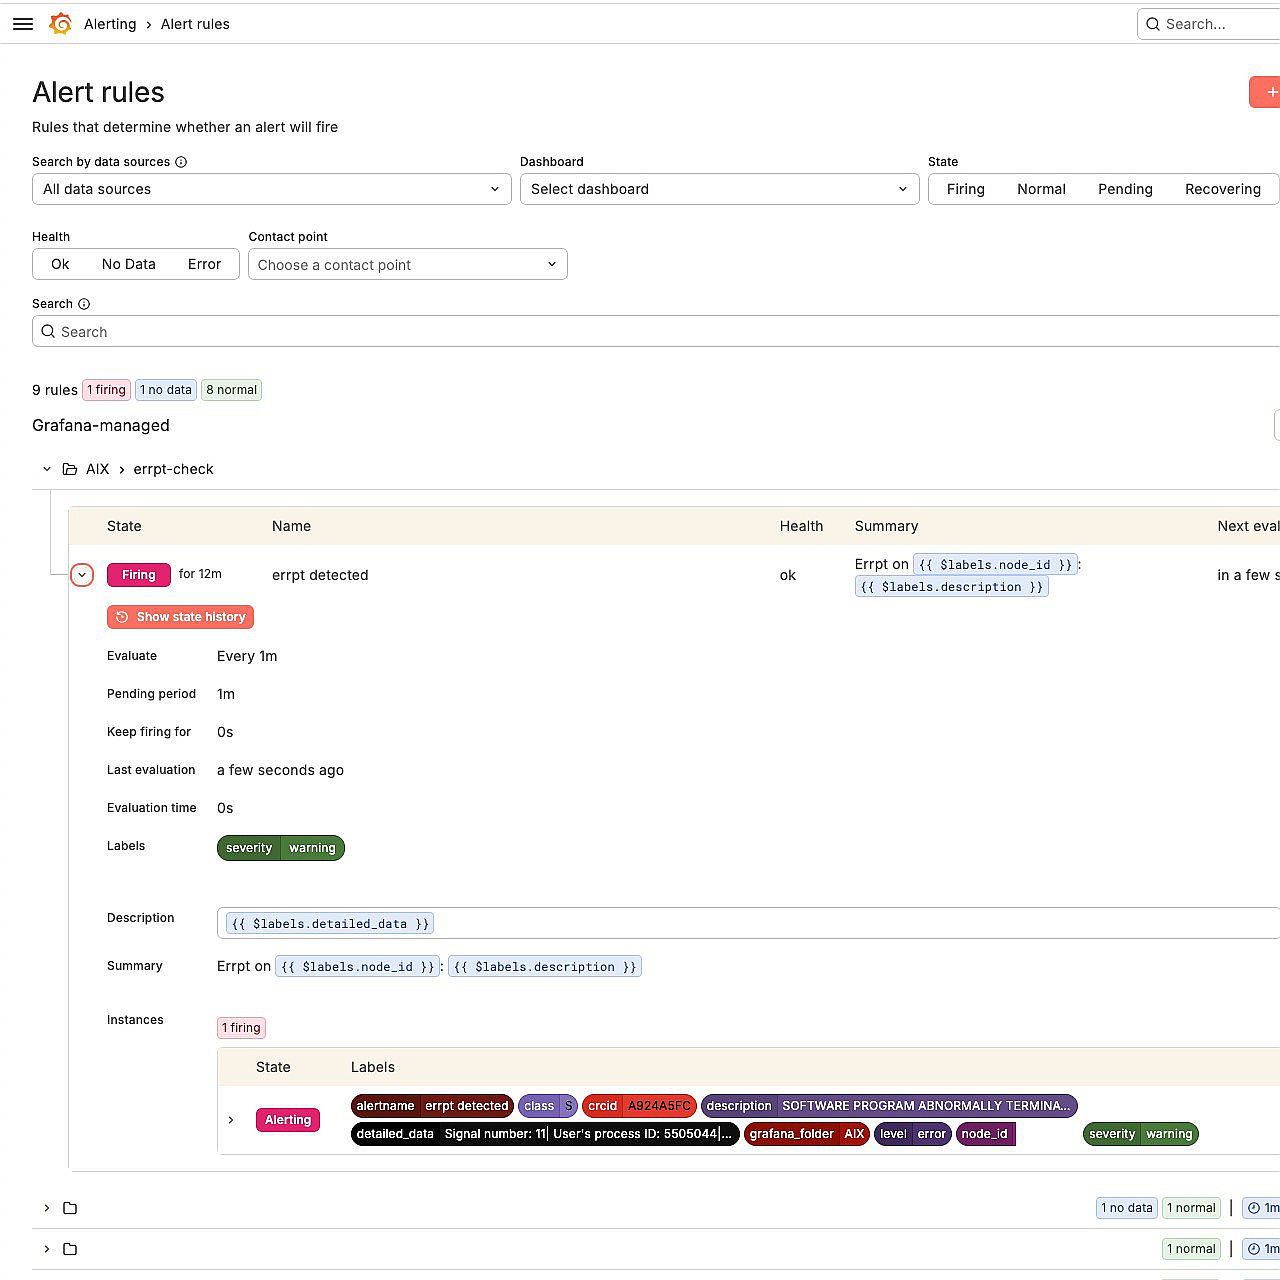
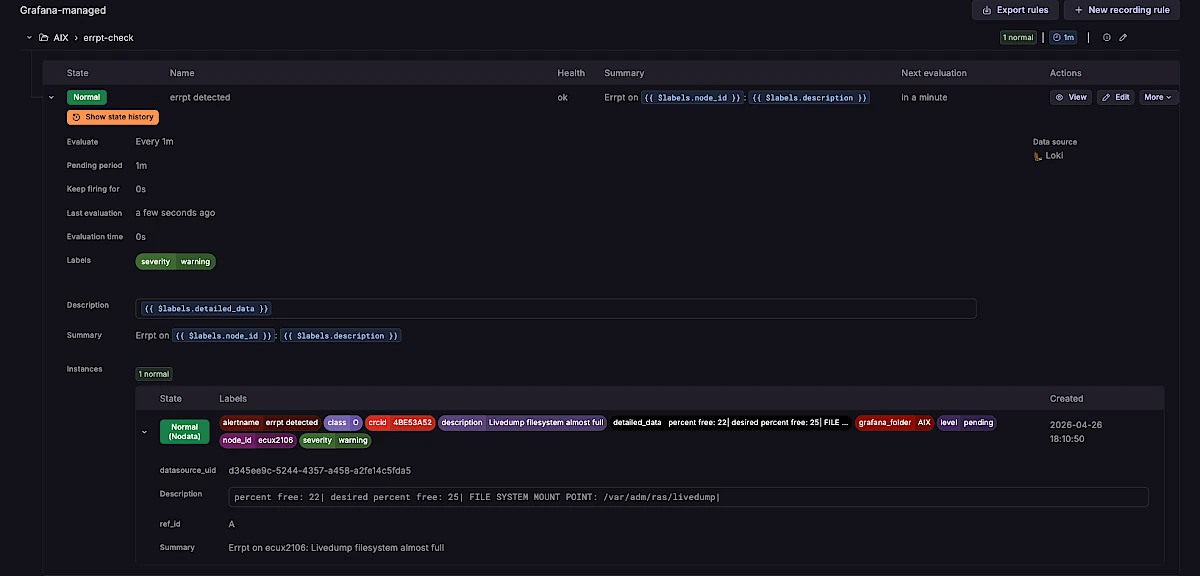
Create your alert rules
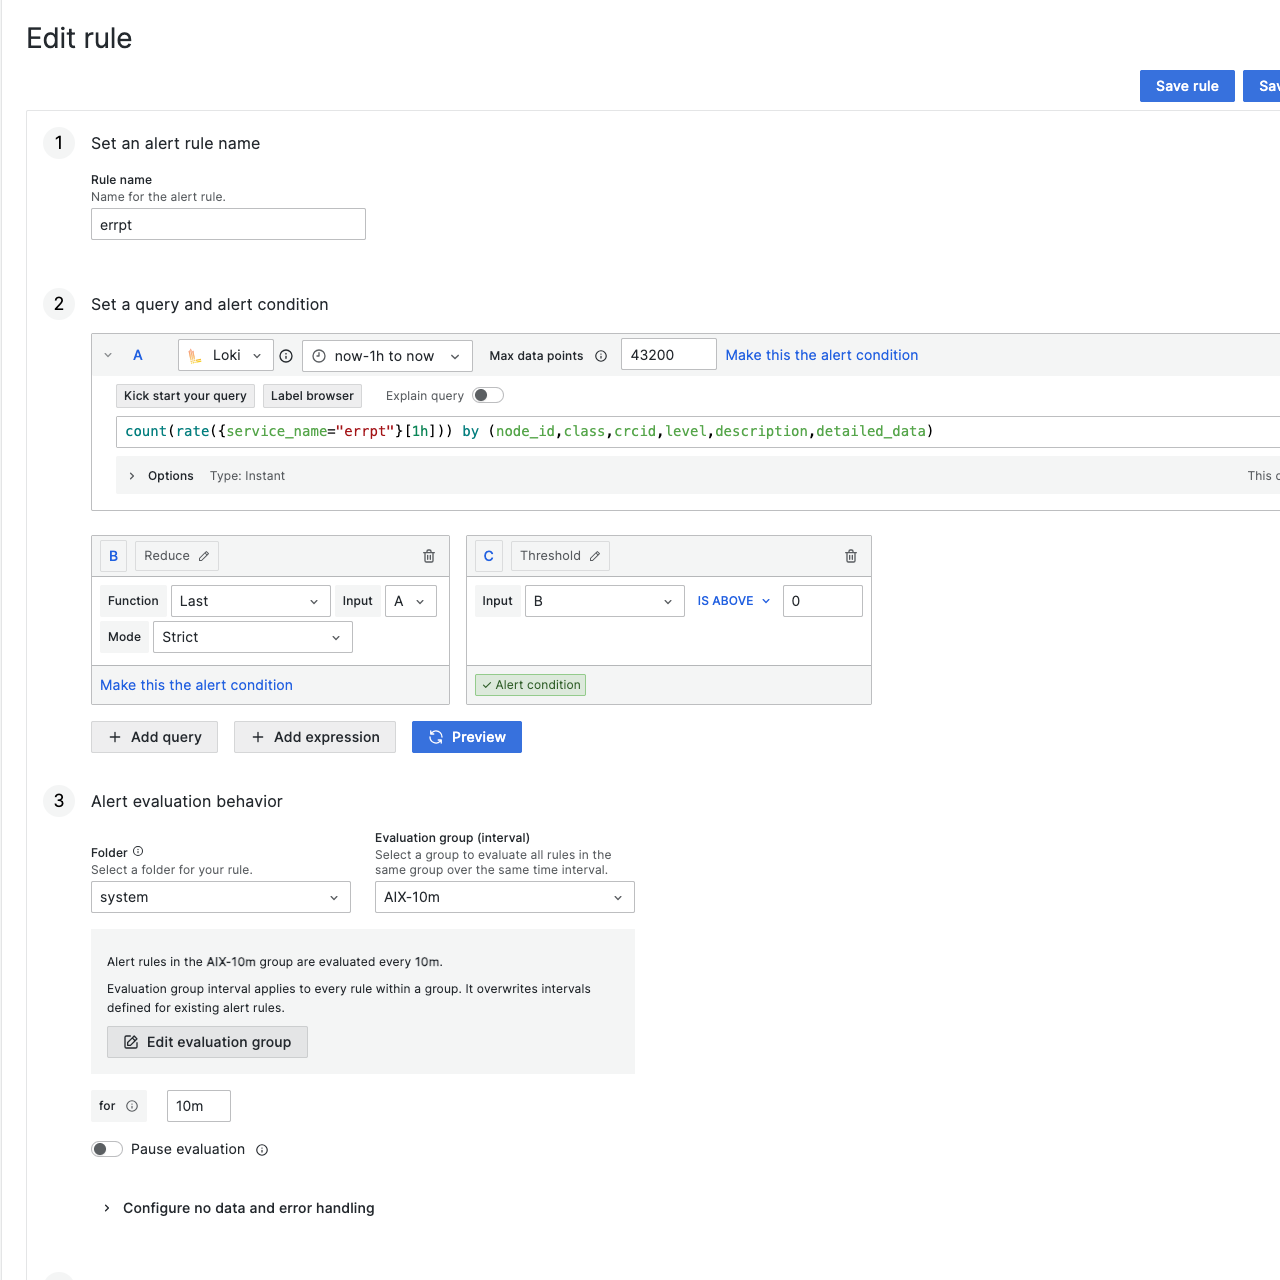
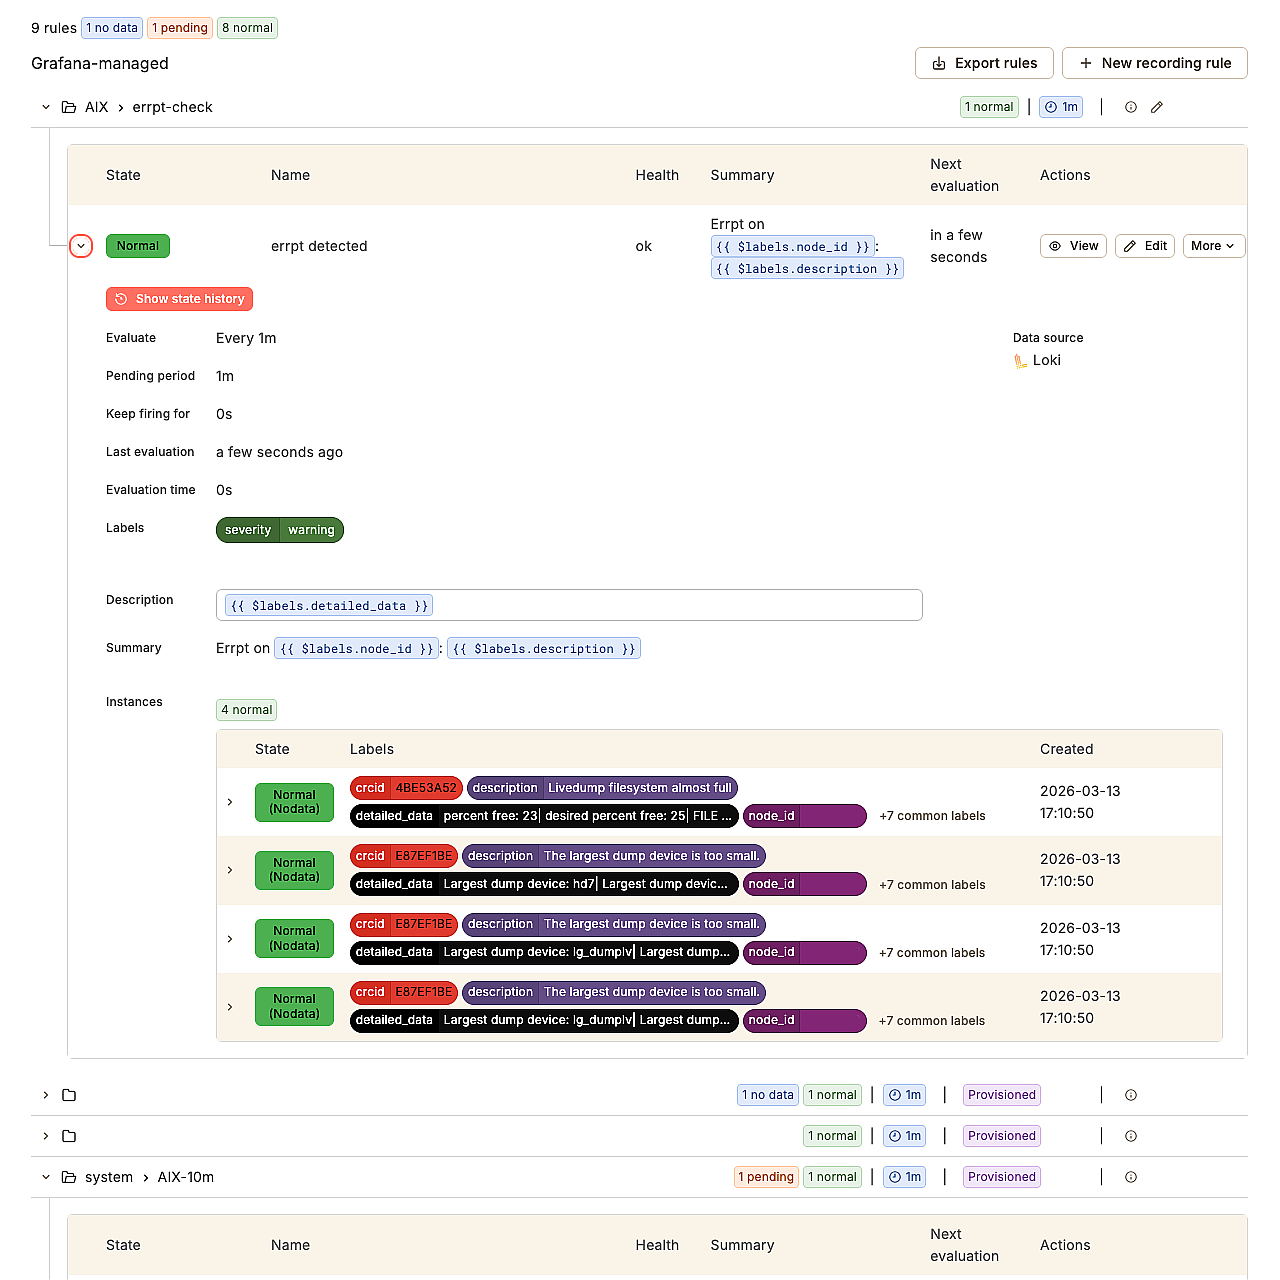
Define alert rules in Grafana directly on top of your errpt streams. Trigger on hardware faults, error rate spikes, or repeated failures across the fleet — routed to Slack, PagerDuty, email, or any webhook your team already uses. No extra agent, no second alerting stack.
Push the alerts wherever you want
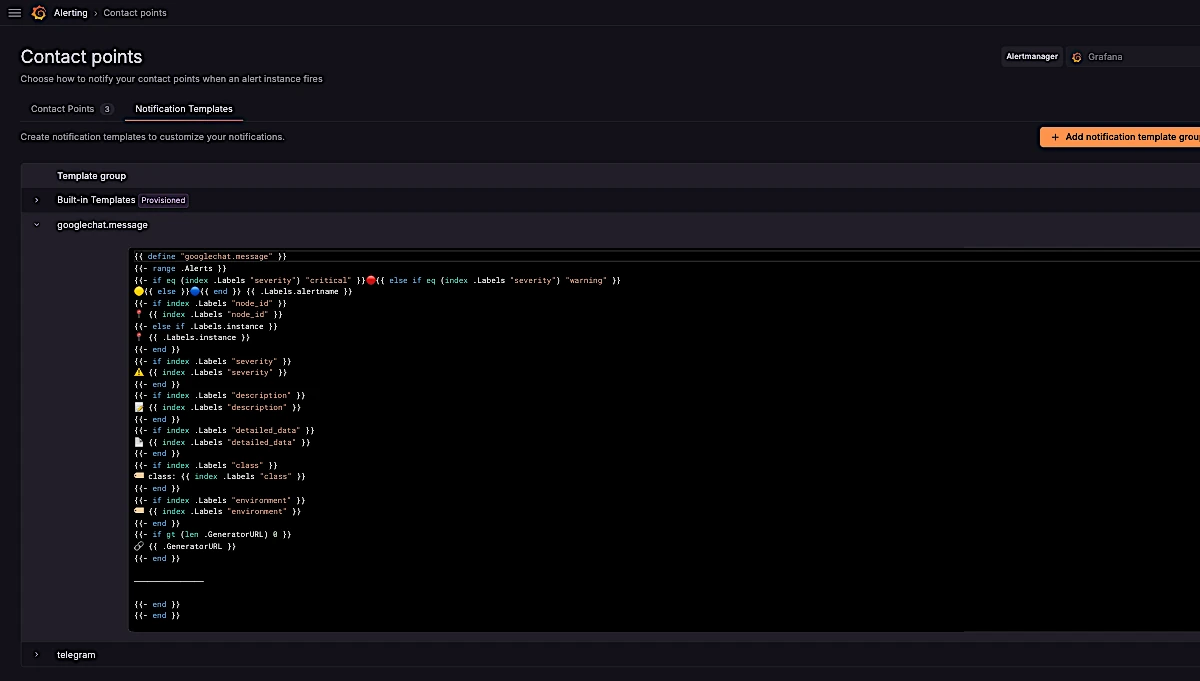
Configure contact points once in Grafana, then route any alert wherever your team actually pays attention — Slack, Microsoft Teams, PagerDuty, Telegram, email, or any webhook. Match urgency to channel: paging for hardware faults, Slack for warnings, email for digests.
Example LogQL Queries
Once data is flowing, you can answer real questions with LogQL. A few examples your ops team will actually run:
# Show all hardware errors across the fleet
{job="aix-errpt", class="H"}

# Find disk-related errors on any host
{job="aix-errpt", resource=~"hdisk.*"}

# Error rate per LPAR over 24h
count_over_time({job="aix-errpt"}[24h]) by (hostname)
Use Cases
Compliance & audit
Searchable historical record of every errpt event across your fleet. Long retention, queryable any time, exportable for audits.
Cross-source correlation
Combine errpt streams with Prometheus metrics from AIX_exporter to tie hardware errors to CPU, memory, or I/O spikes — full picture in one Grafana view.
Faster troubleshooting
Filter and pivot across hosts, classes, and resources in seconds. No more grepping individual errlog files on each LPAR.
Trend & pattern analysis
Spot recurring errors, degrading hardware, or noisy resources over weeks and months — anticipate failures before they cascade.
Specs & Requirements
| Operating System | IBM AIX 7.1, 7.2, 7.3 |
| Architecture | IBM Power Systems (POWER7 and later) |
| Disk space | < 1 MB |
| Memory | < 3 MB RSS |
| CPU overhead | Negligible — event-driven, sleeps between errpt entries |
| Dependencies | None for the standard build (AIX base libraries only). TLS build requires libssl and libcrypto from AIX base OpenSSL 3. |
| Network | Outbound HTTP/HTTPS to Loki (default port 3100) |
| Grafana Loki | 2.x or 3.x |
| Grafana | 9.x, 10.x, 11.x, 12.x |
Deploy on AIX in 5 minutes
Standard AIX BFF package, registered as an SRC subsystem with auto-start. Install with installp, manage with startsrc/stopsrc. All configuration in a single file at /etc/loki/loki-agent.conf.
# 1. Install the BFF package
installp -aXYgd /path/to/loki-agent.1.0.0.1.bff all

# 2. Edit configuration
vi /etc/loki/loki-agent.conf

# 3. Start the agent
startsrc -s loki-agent

# 4. Verify in Grafana Explore
{service_name="errpt"} | json
Configuration options
| Feature | Description |
|---|---|
| Loki server | Hostname or IP of your Loki instance with -s <server> |
| Configurable port | Connect on any port with -p <port> (default: 3100) |
| TLS encryption | Secure connection to Loki with -t flag |
| Custom API path | Override the Loki Push API endpoint with -u <path> |
| Custom error log path | Read from a different errlog with -e <path> |
| Configuration file | All options in /etc/loki/loki-agent.conf |
| Batch replay mode | Parse entire error log history with -b and exit |
| Syslog integration | All events logged to syslog — startup, errors, forwarding status |
| SRC managed | Registered as AIX SRC subsystem — startsrc/stopsrc |
| Auto-start on boot | Inittab entry created automatically |
| Standard BFF package | Native AIX installp installation |
Licensing
Annual subscription — €40 per LPAR per year, billed via Stripe. Updates and support are always included. Cancel anytime; your monitoring keeps running to the end of the paid term.
Frequently Asked Questions
You may also like…
Related products
-
-
power-hmc-exporter
From: 45 € / LPAR / yearSelect options This product has multiple variants. The options may be chosen on the product page