AIX Monitoring
power-hmc-exporter
Map your entire PowerVM virtualization layer from the HMC: shared CPU & memory pools, LPAR↔VIOS relationships, and SEA / NPIV / VSCSI attribution — as Prometheus metrics with cross-reference labels pre-resolved. Agentless, three dashboards included. Annual subscription — per LPAR, or a flat per-HMC plan.
power-hmc-exporter — Your Entire PowerVM Virtualization Layer, Mapped
Most Power monitoring stops at the operating system: CPU, memory and disks inside each LPAR. But the questions that actually cost you time live one layer down, in the virtualization — which shared pool is saturated, which VIOS bottlenecks which LPARs, which partition hammers a physical Fibre Channel port through NPIV, which LPARs sit behind a given SEA and VLAN. Today, answering them means hand-correlating lsmap, lshwres, fcstat and the HMC into a spreadsheet.
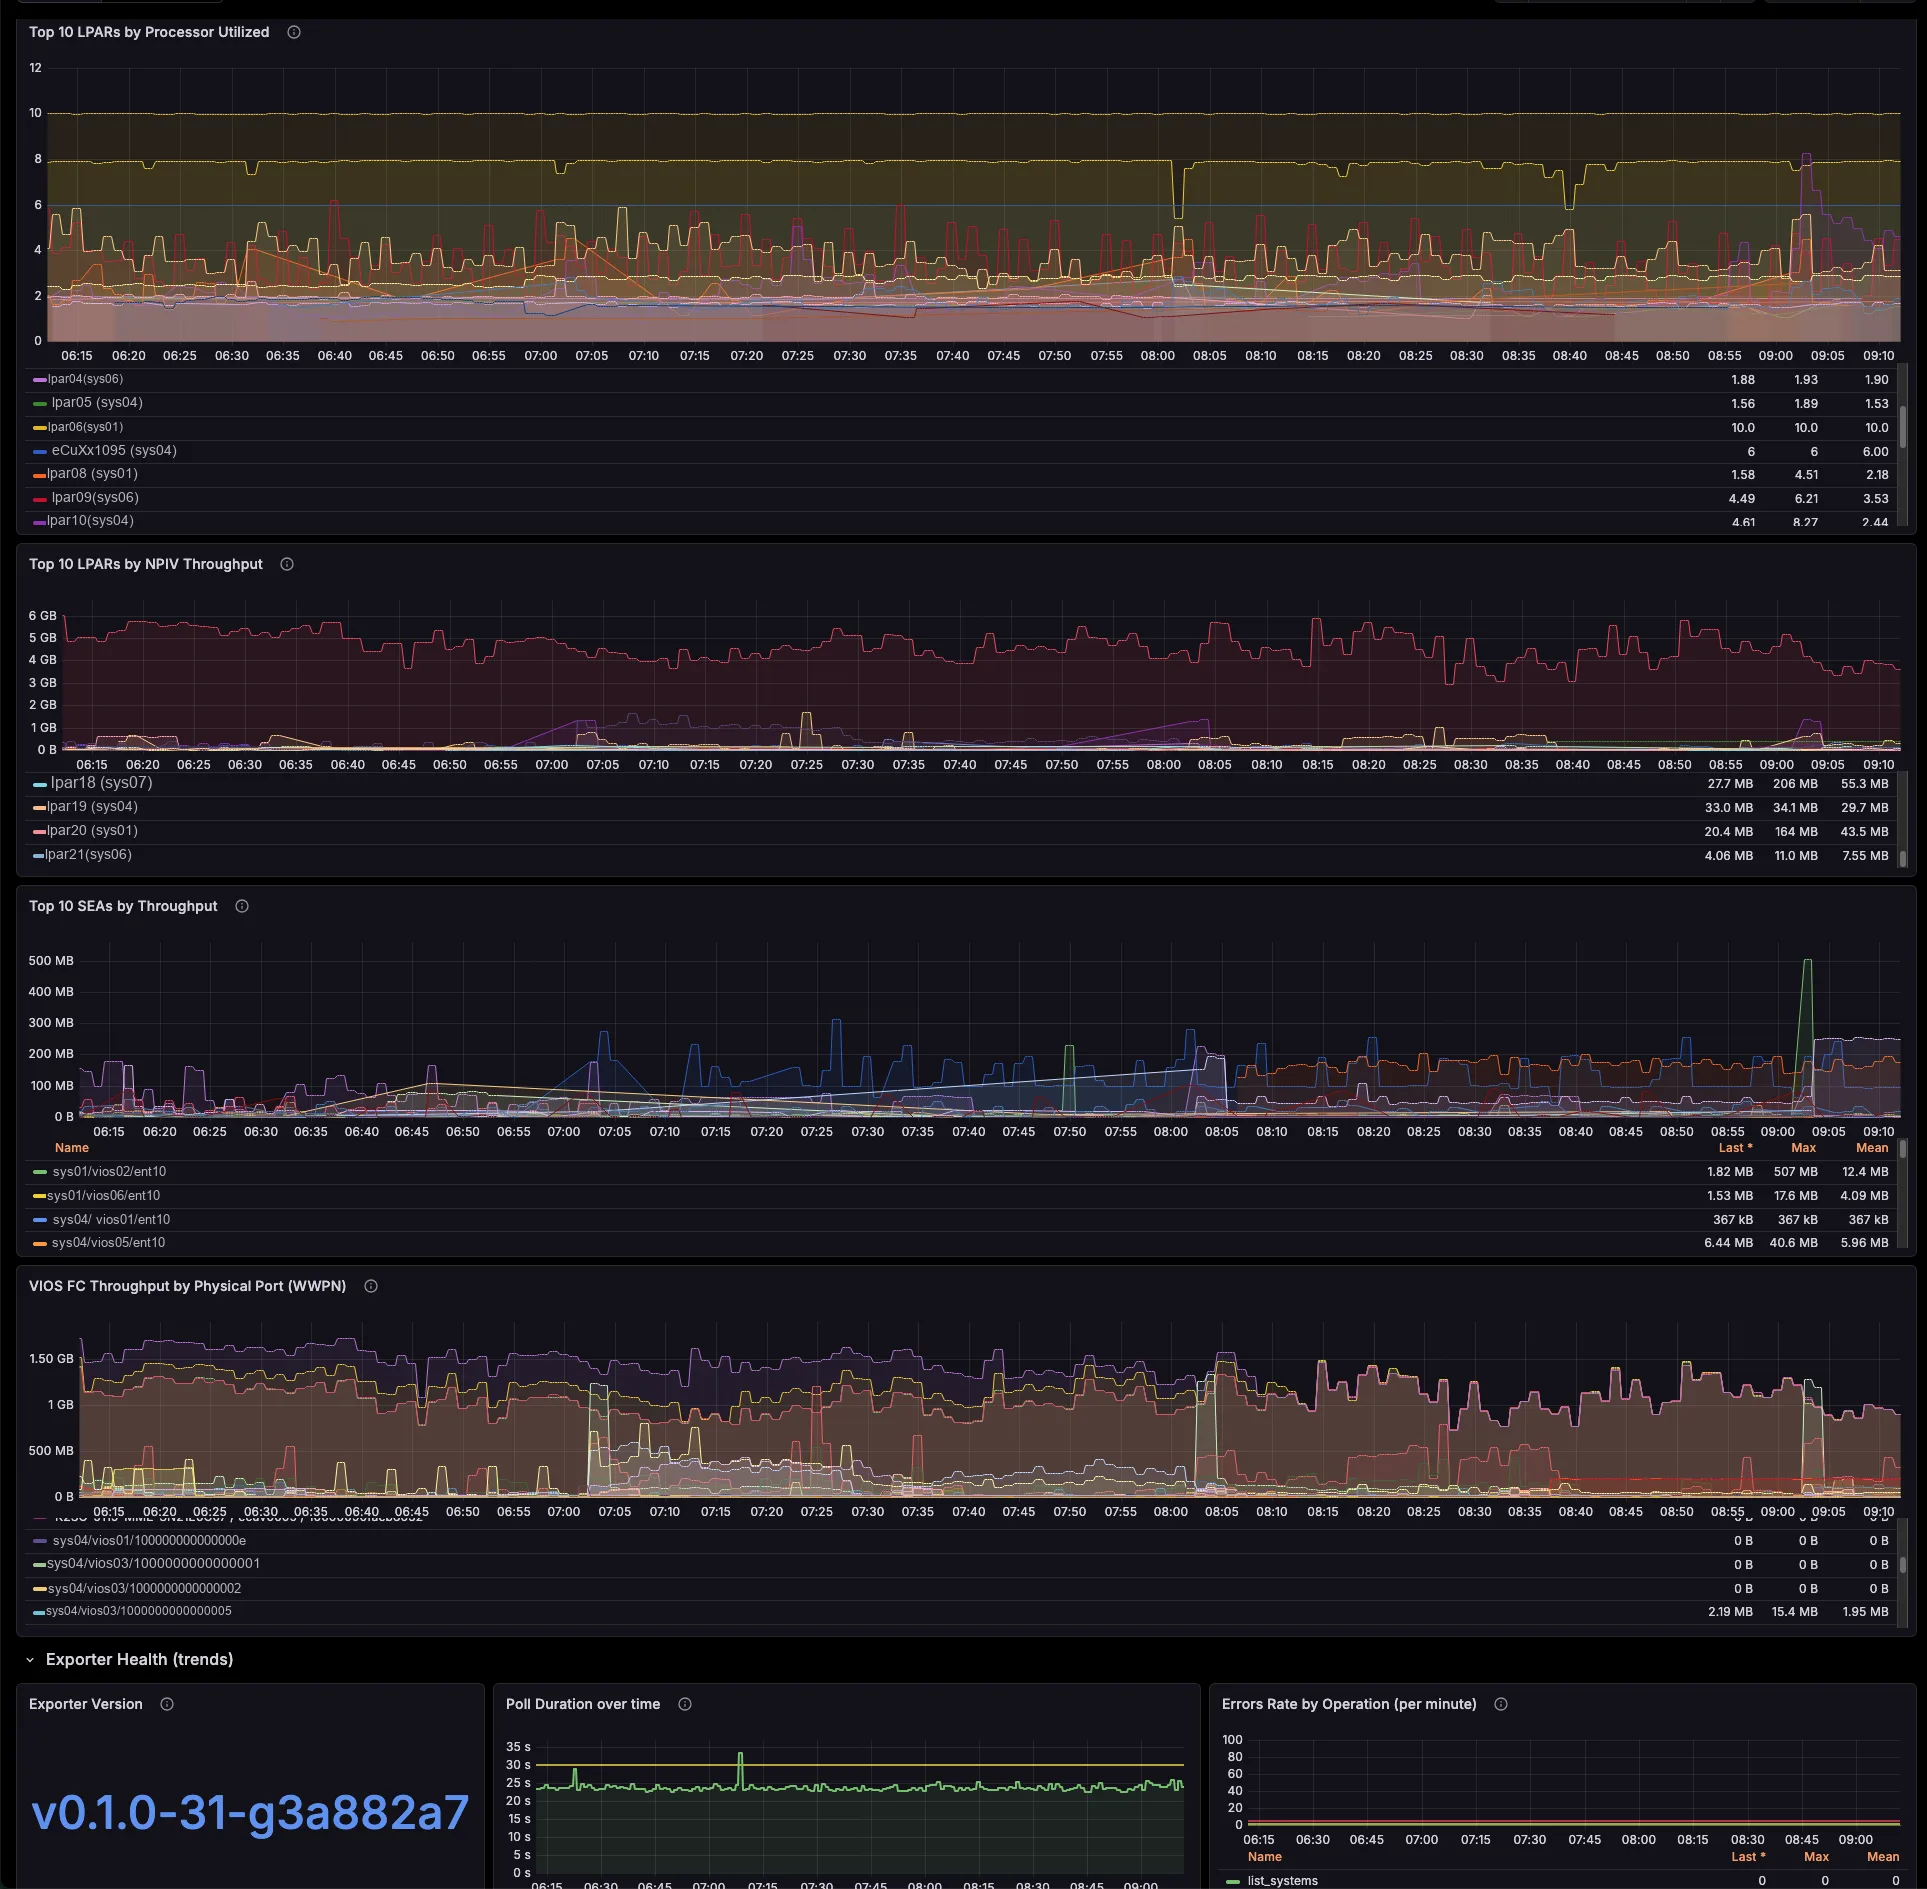
Instead, power-hmc-exporter reads the HMC’s Performance & Capacity Monitoring (PCM) facility and reconstructs that whole topology as live Prometheus metrics — processor and memory pools, the LPAR ↔ VIOS service relationships, and the SEA / NPIV / VSCSI mappings — with the cross-reference labels already resolved. As a result, the spreadsheet archaeology becomes a Grafana dashboard.
Stop guessing about pool contention
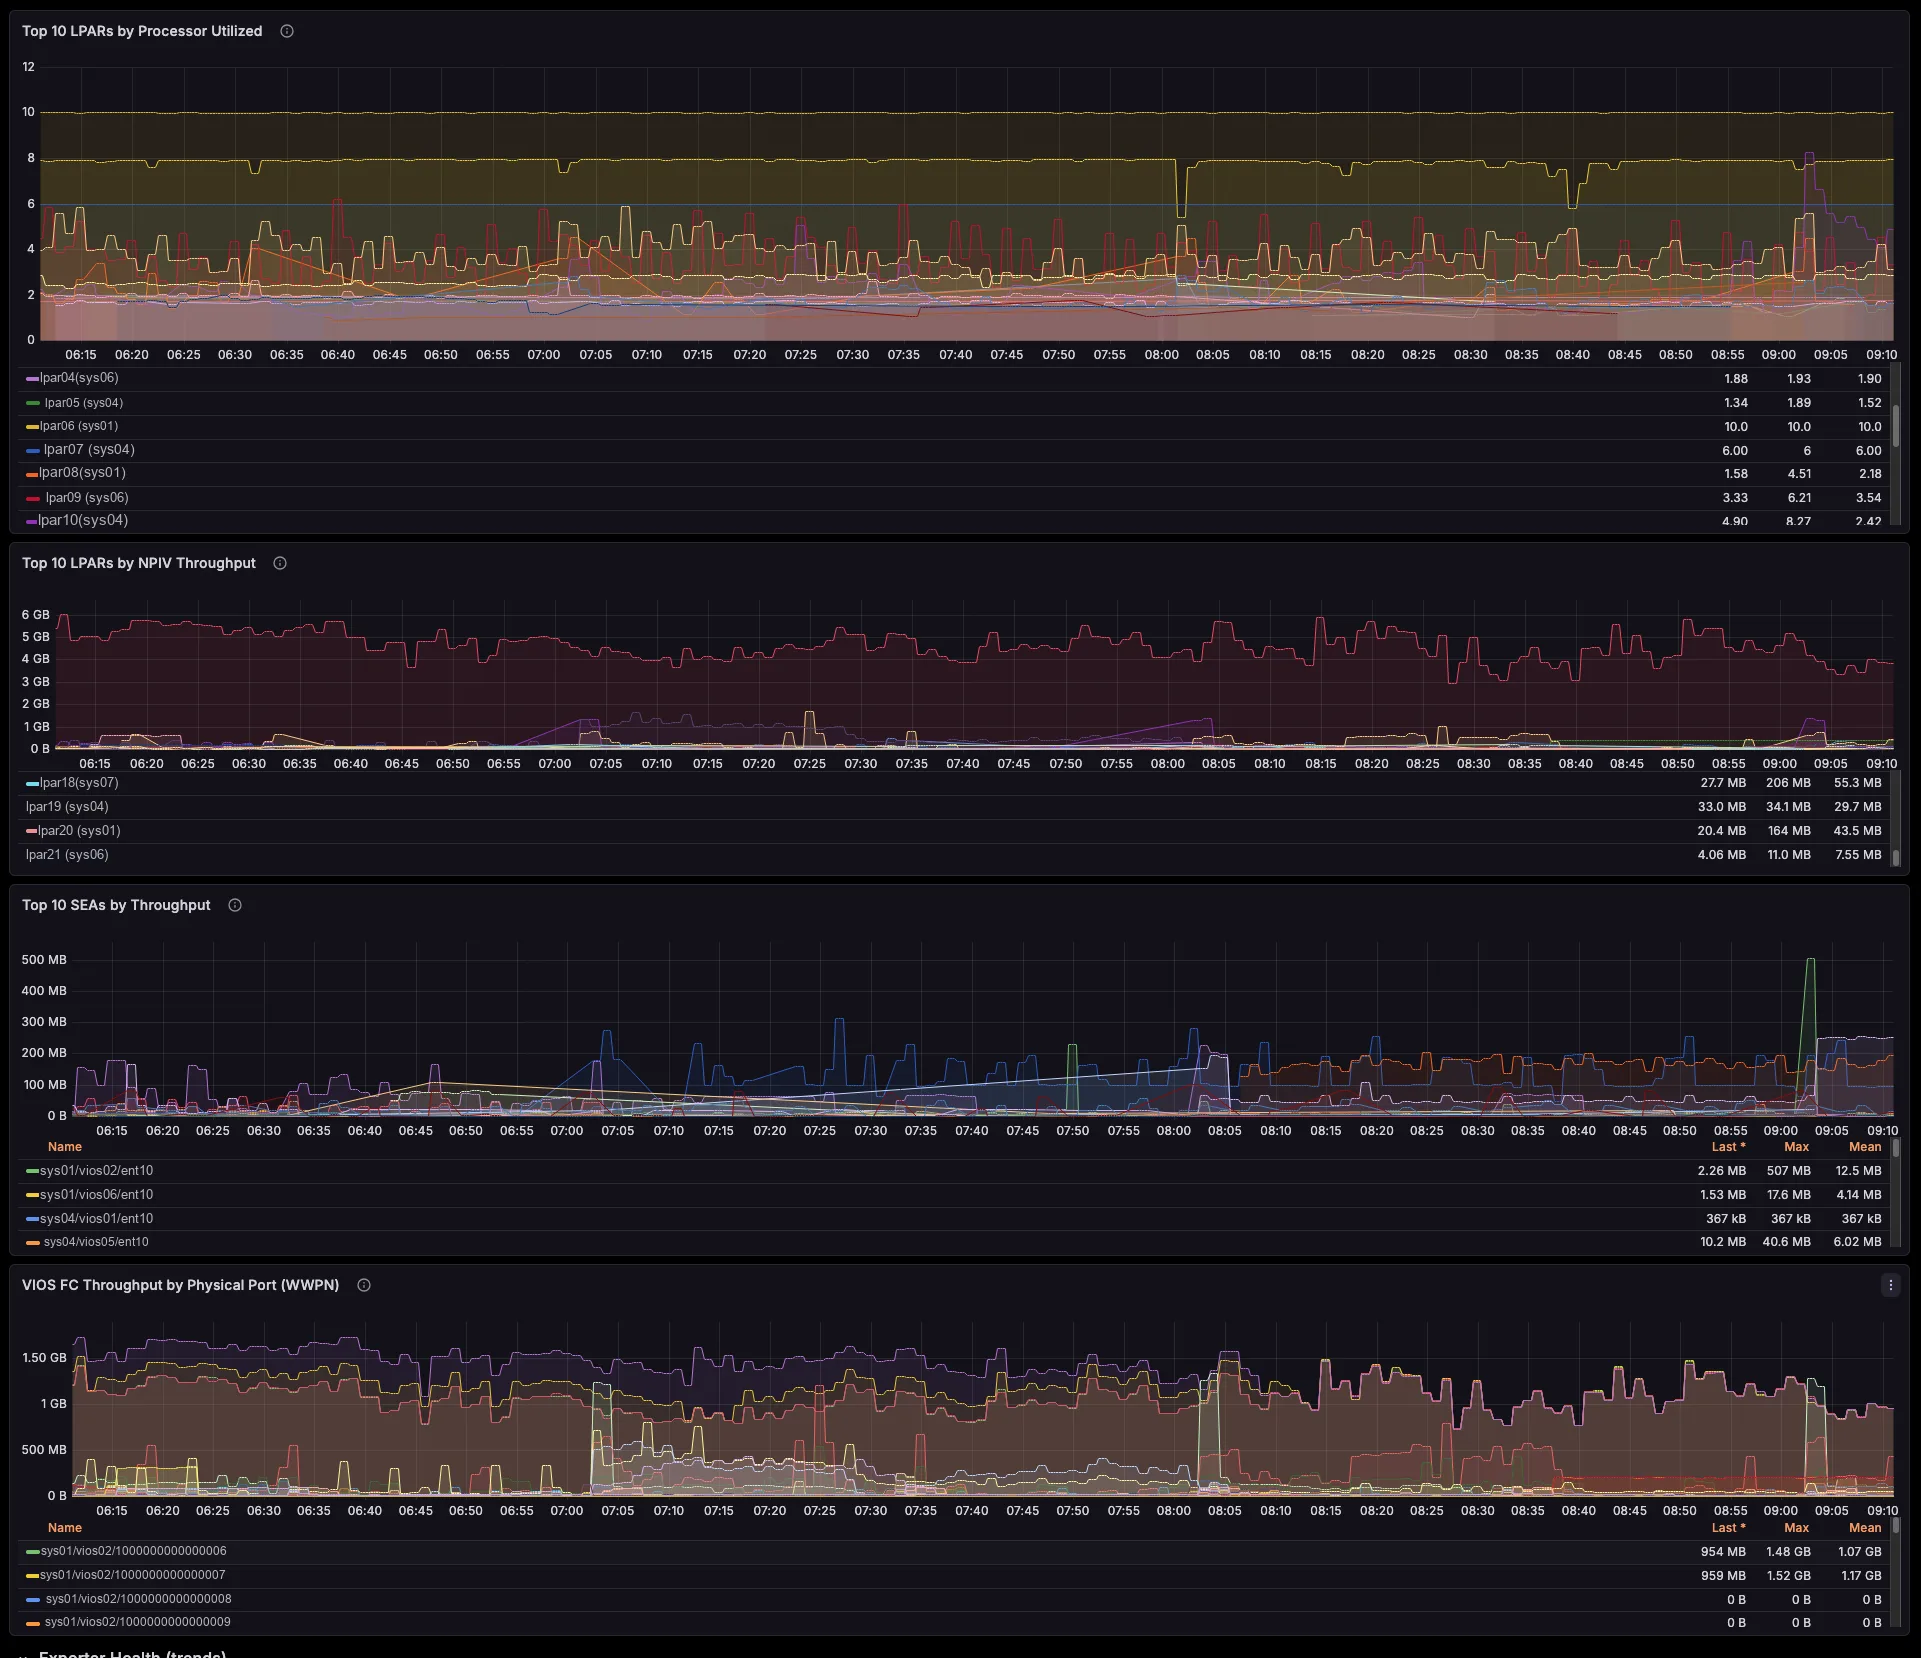
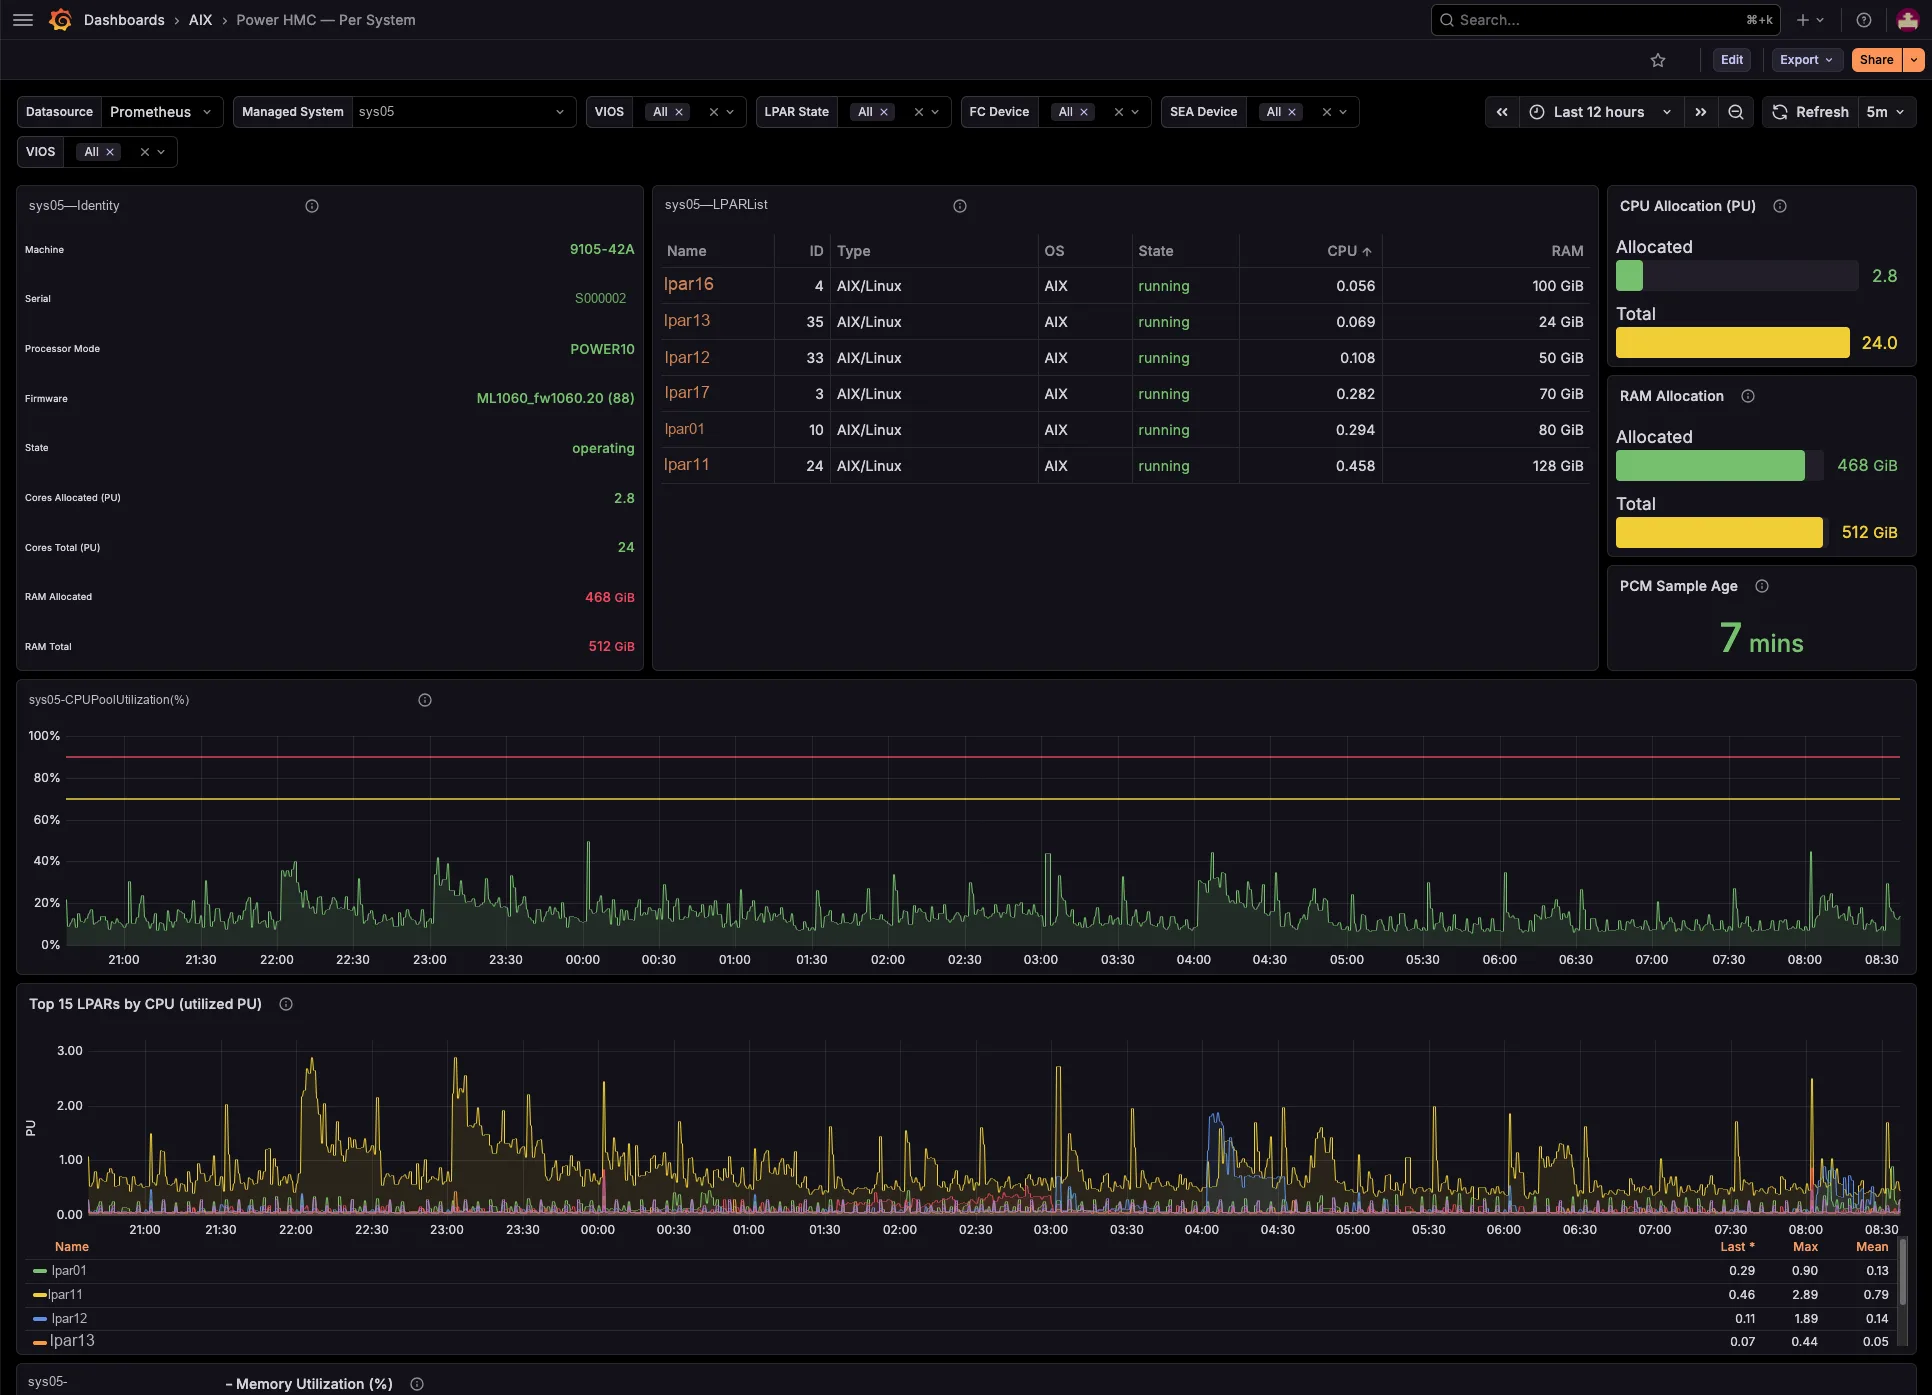
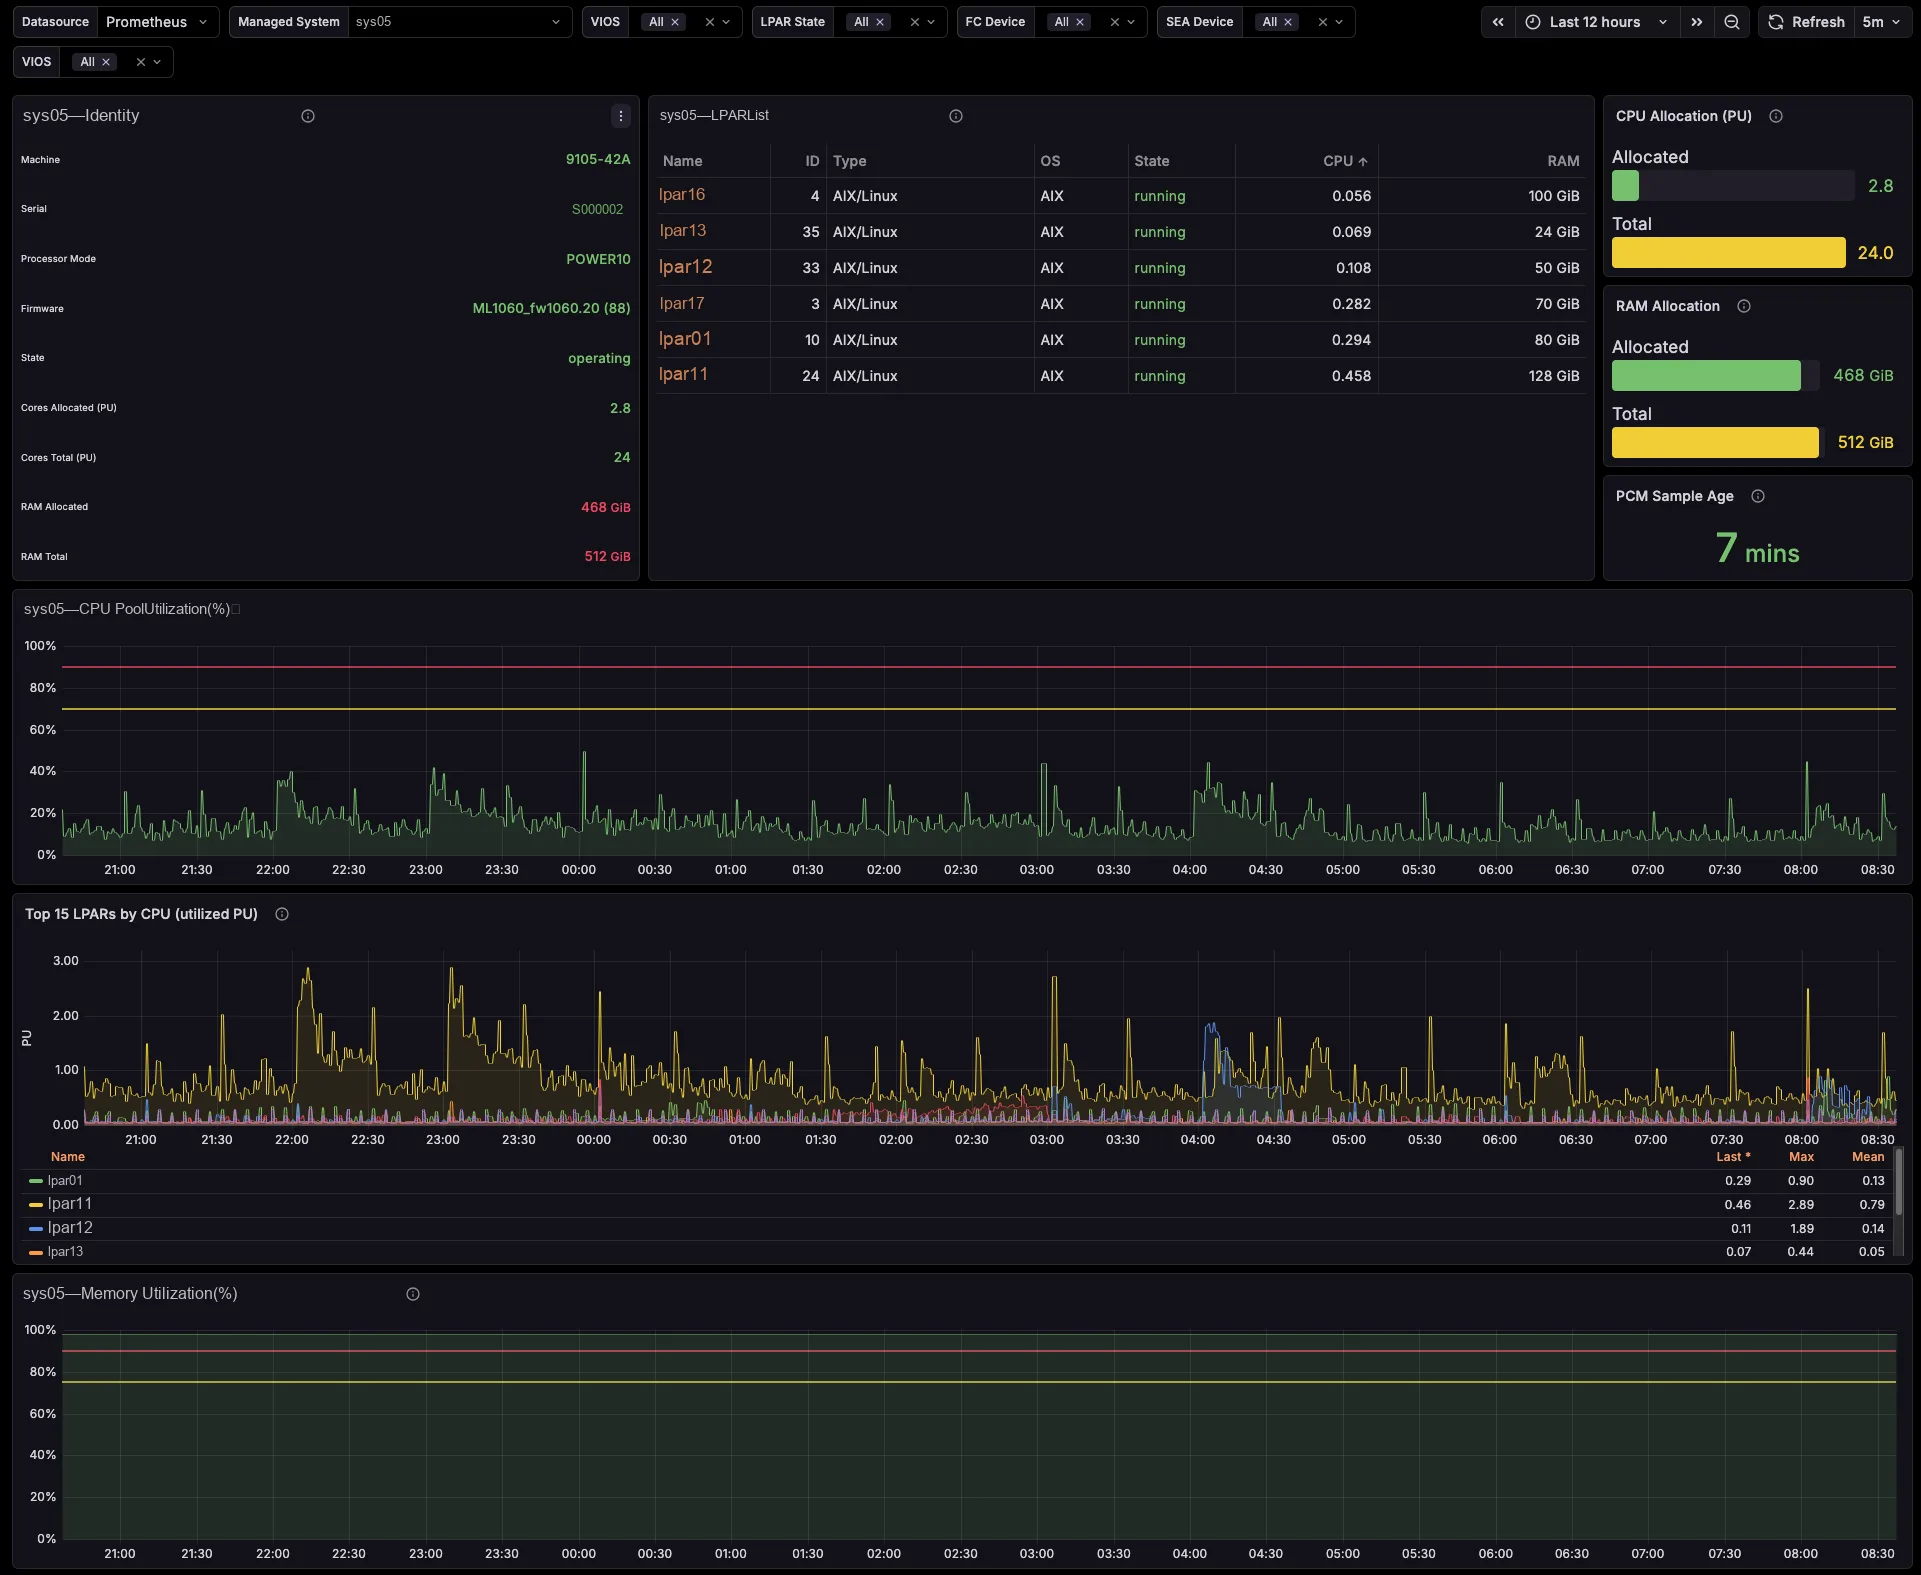
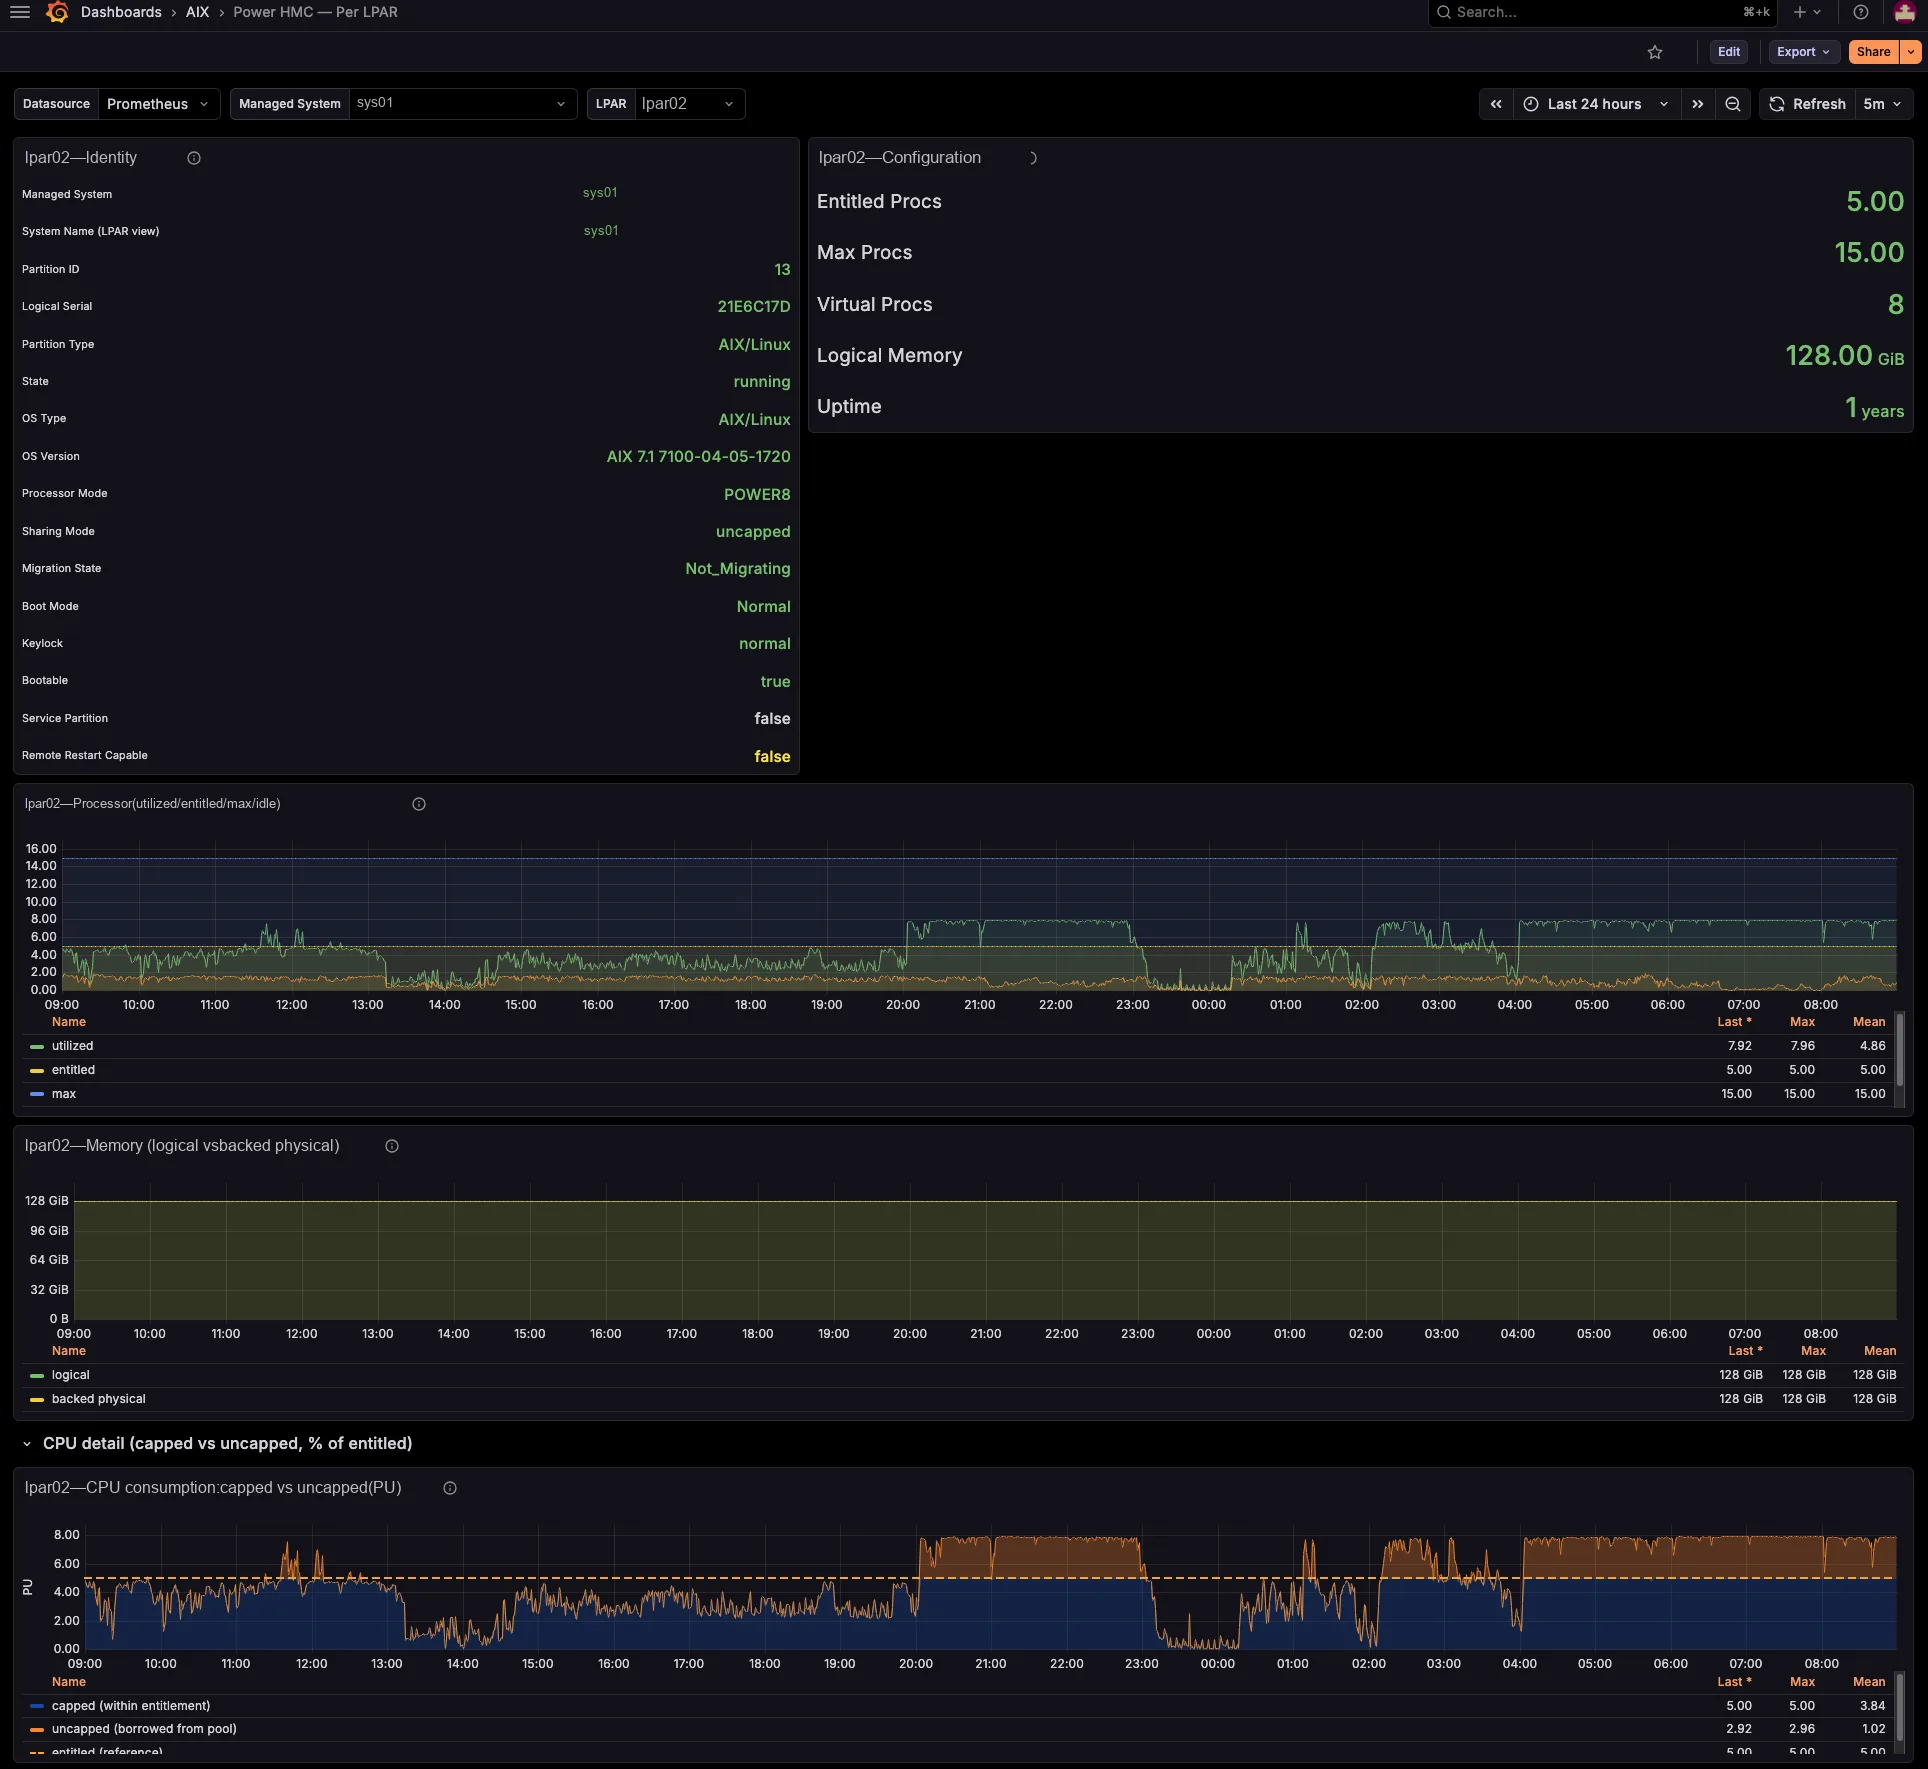
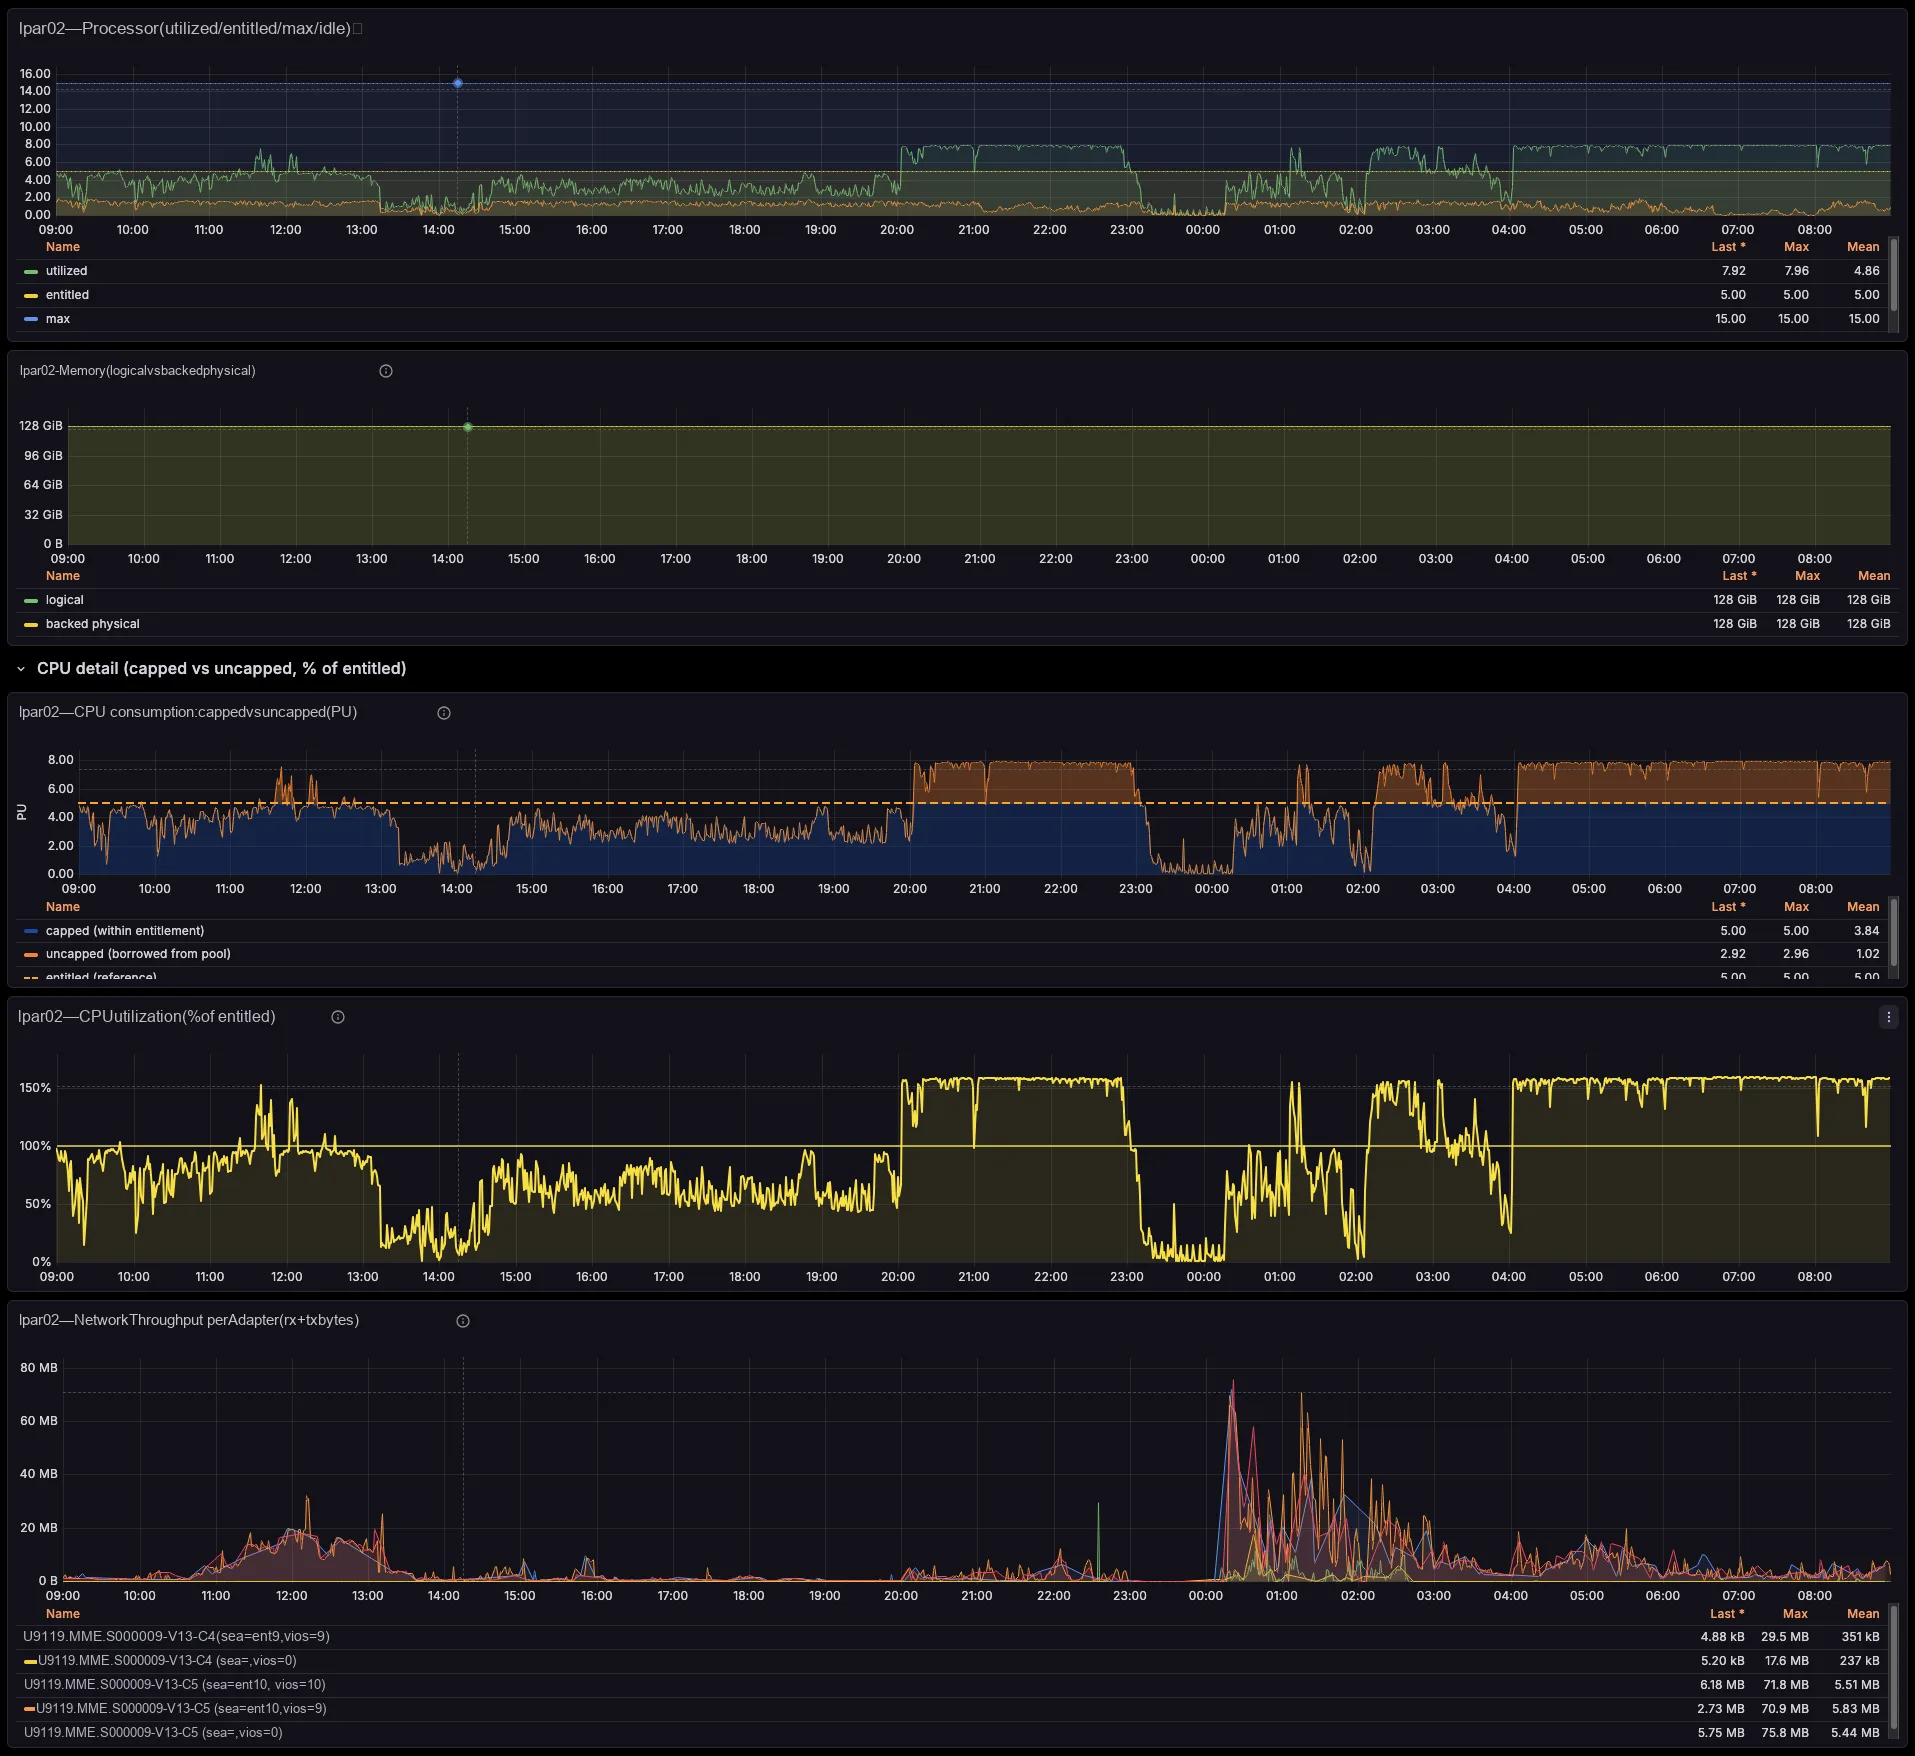
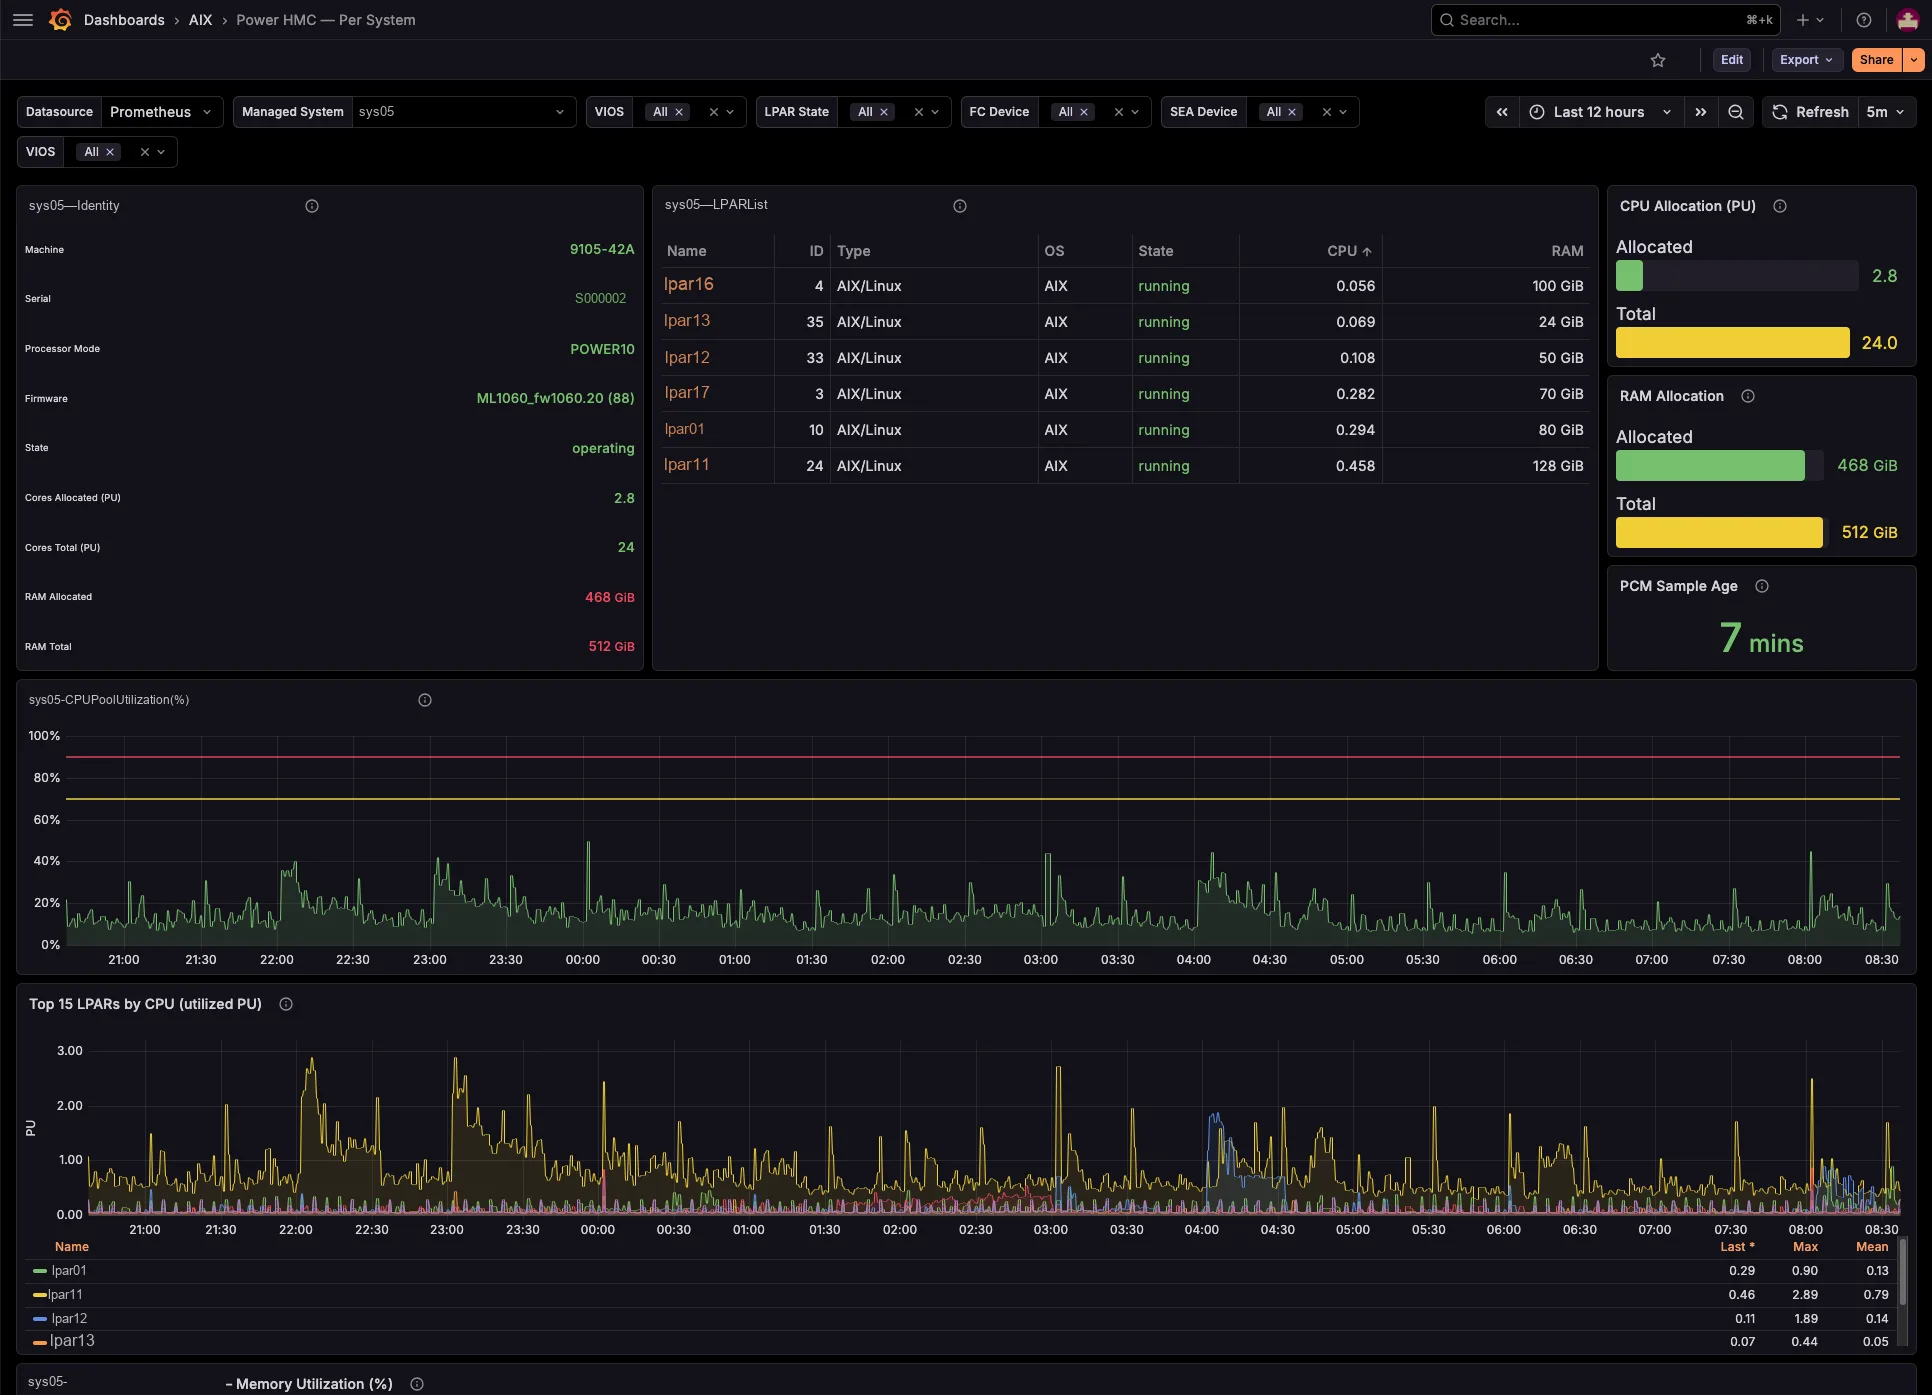
The dashboards track per-managed-system shared processor pool utilization and memory pool allocation versus total, entitled-versus-consumed for every LPAR and VIOS, capped-versus-uncapped borrowing against entitlement, and virtual-processor ceilings. So you see which pool runs tight, and which partitions borrow from it — before your users feel it, not after.
Every LPAR’s serving VIOS, resolved for you
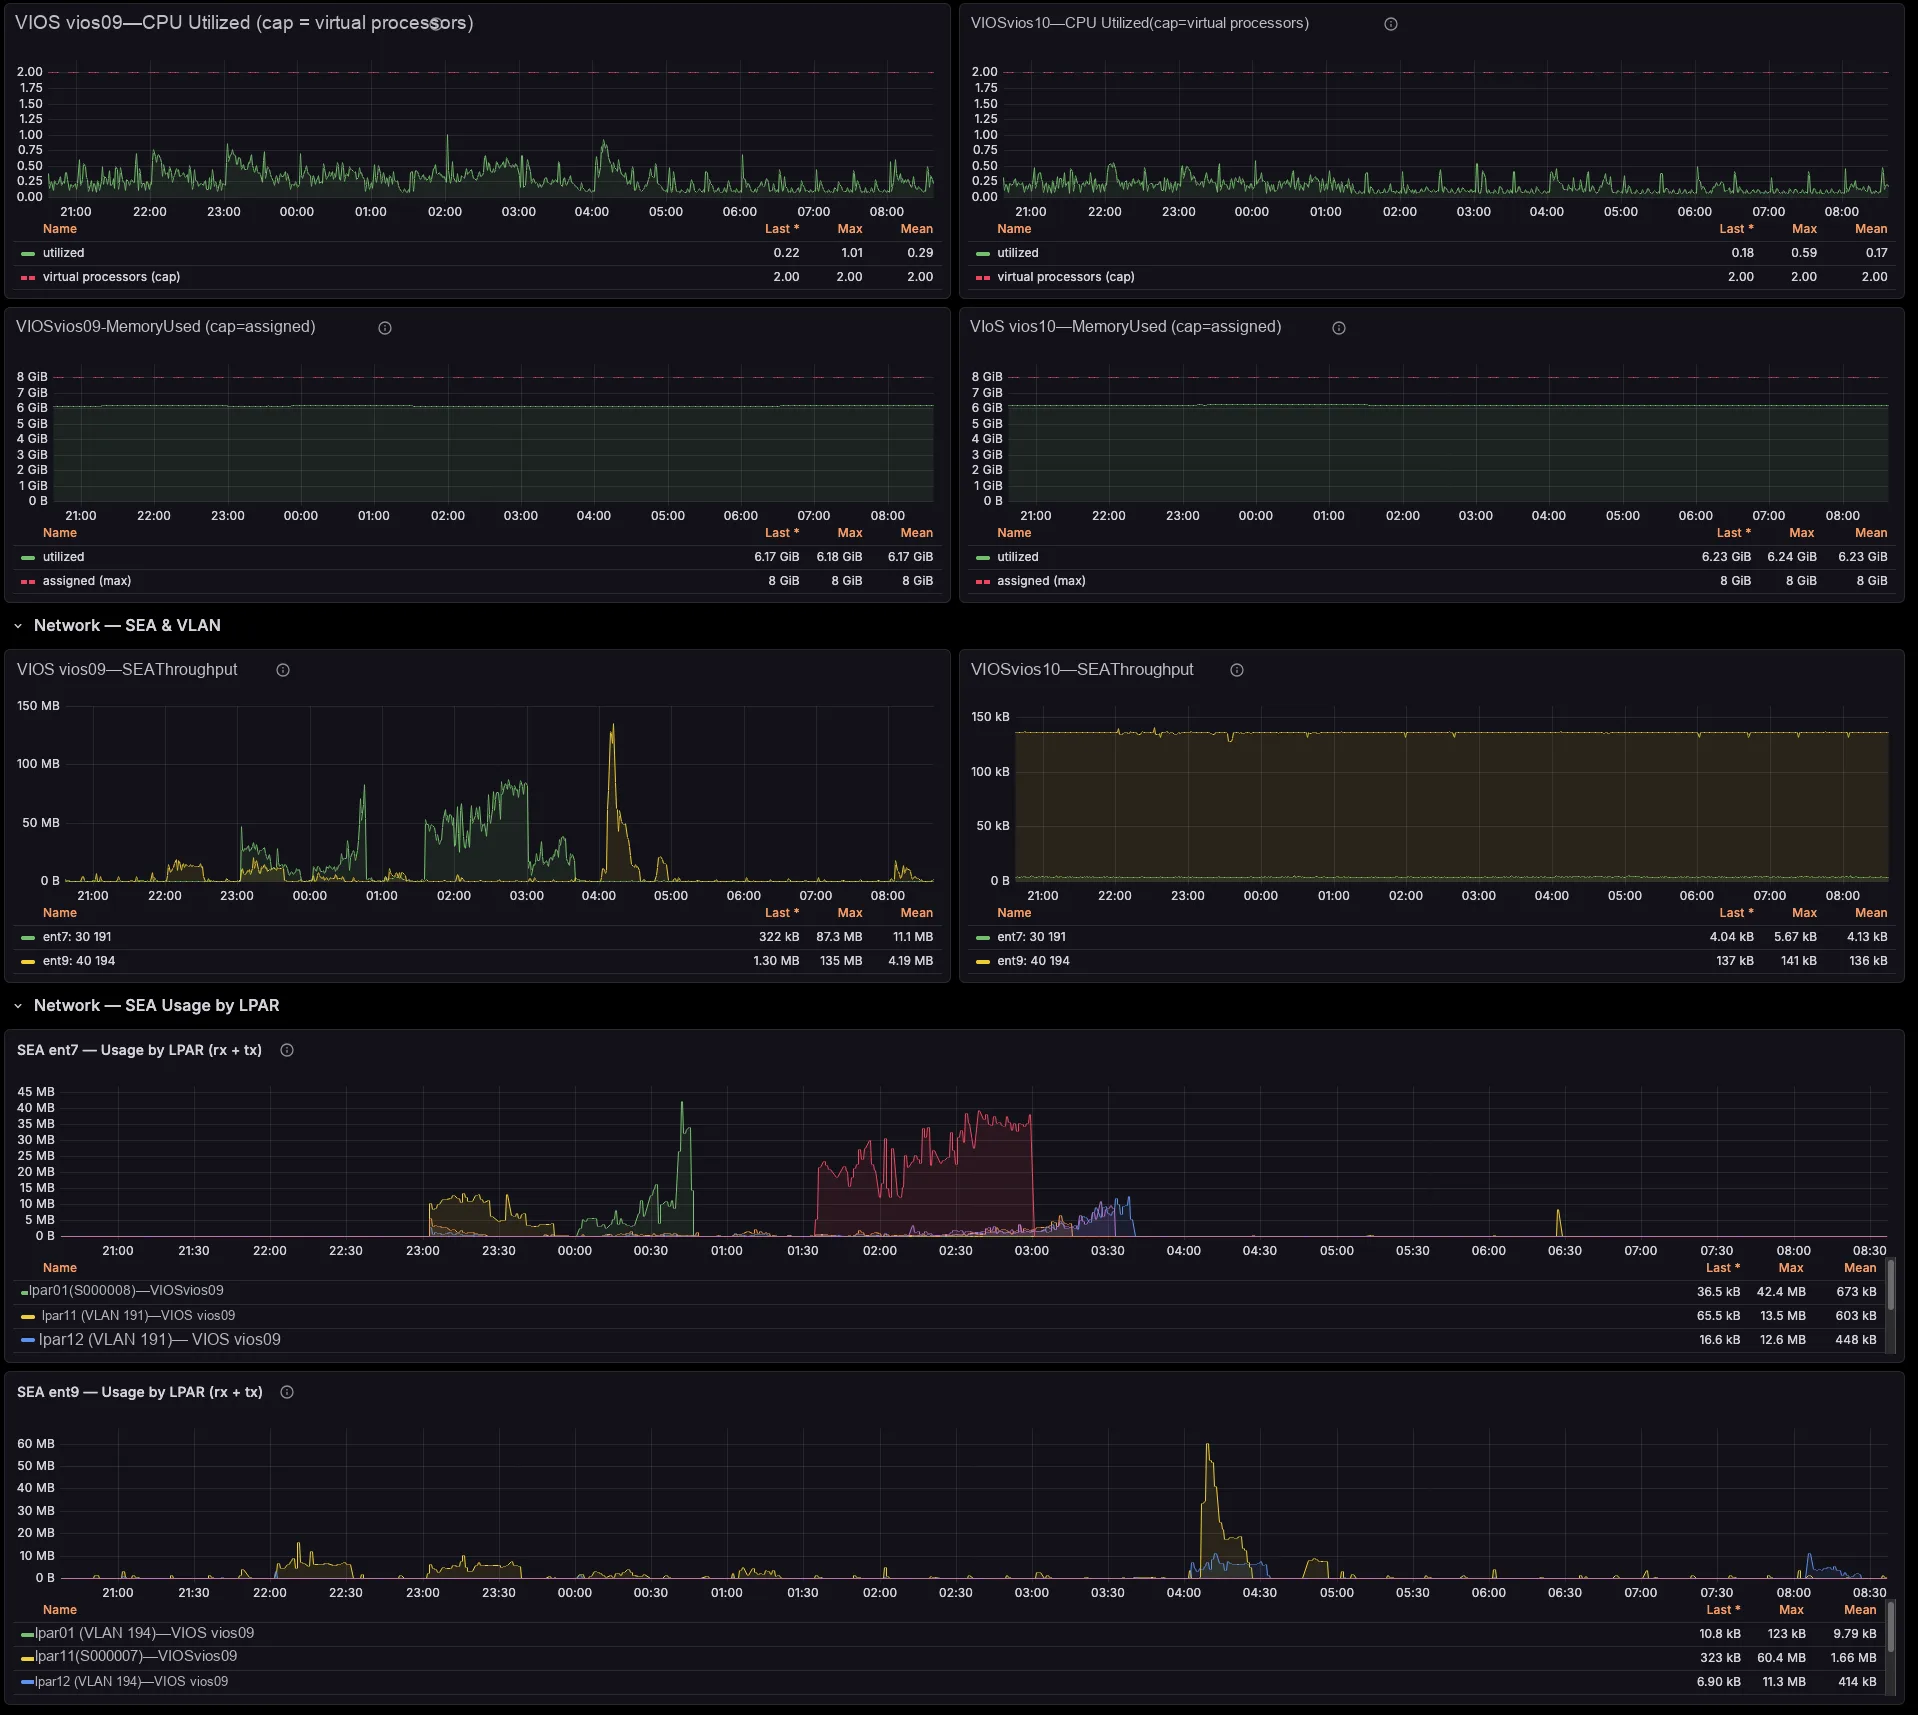
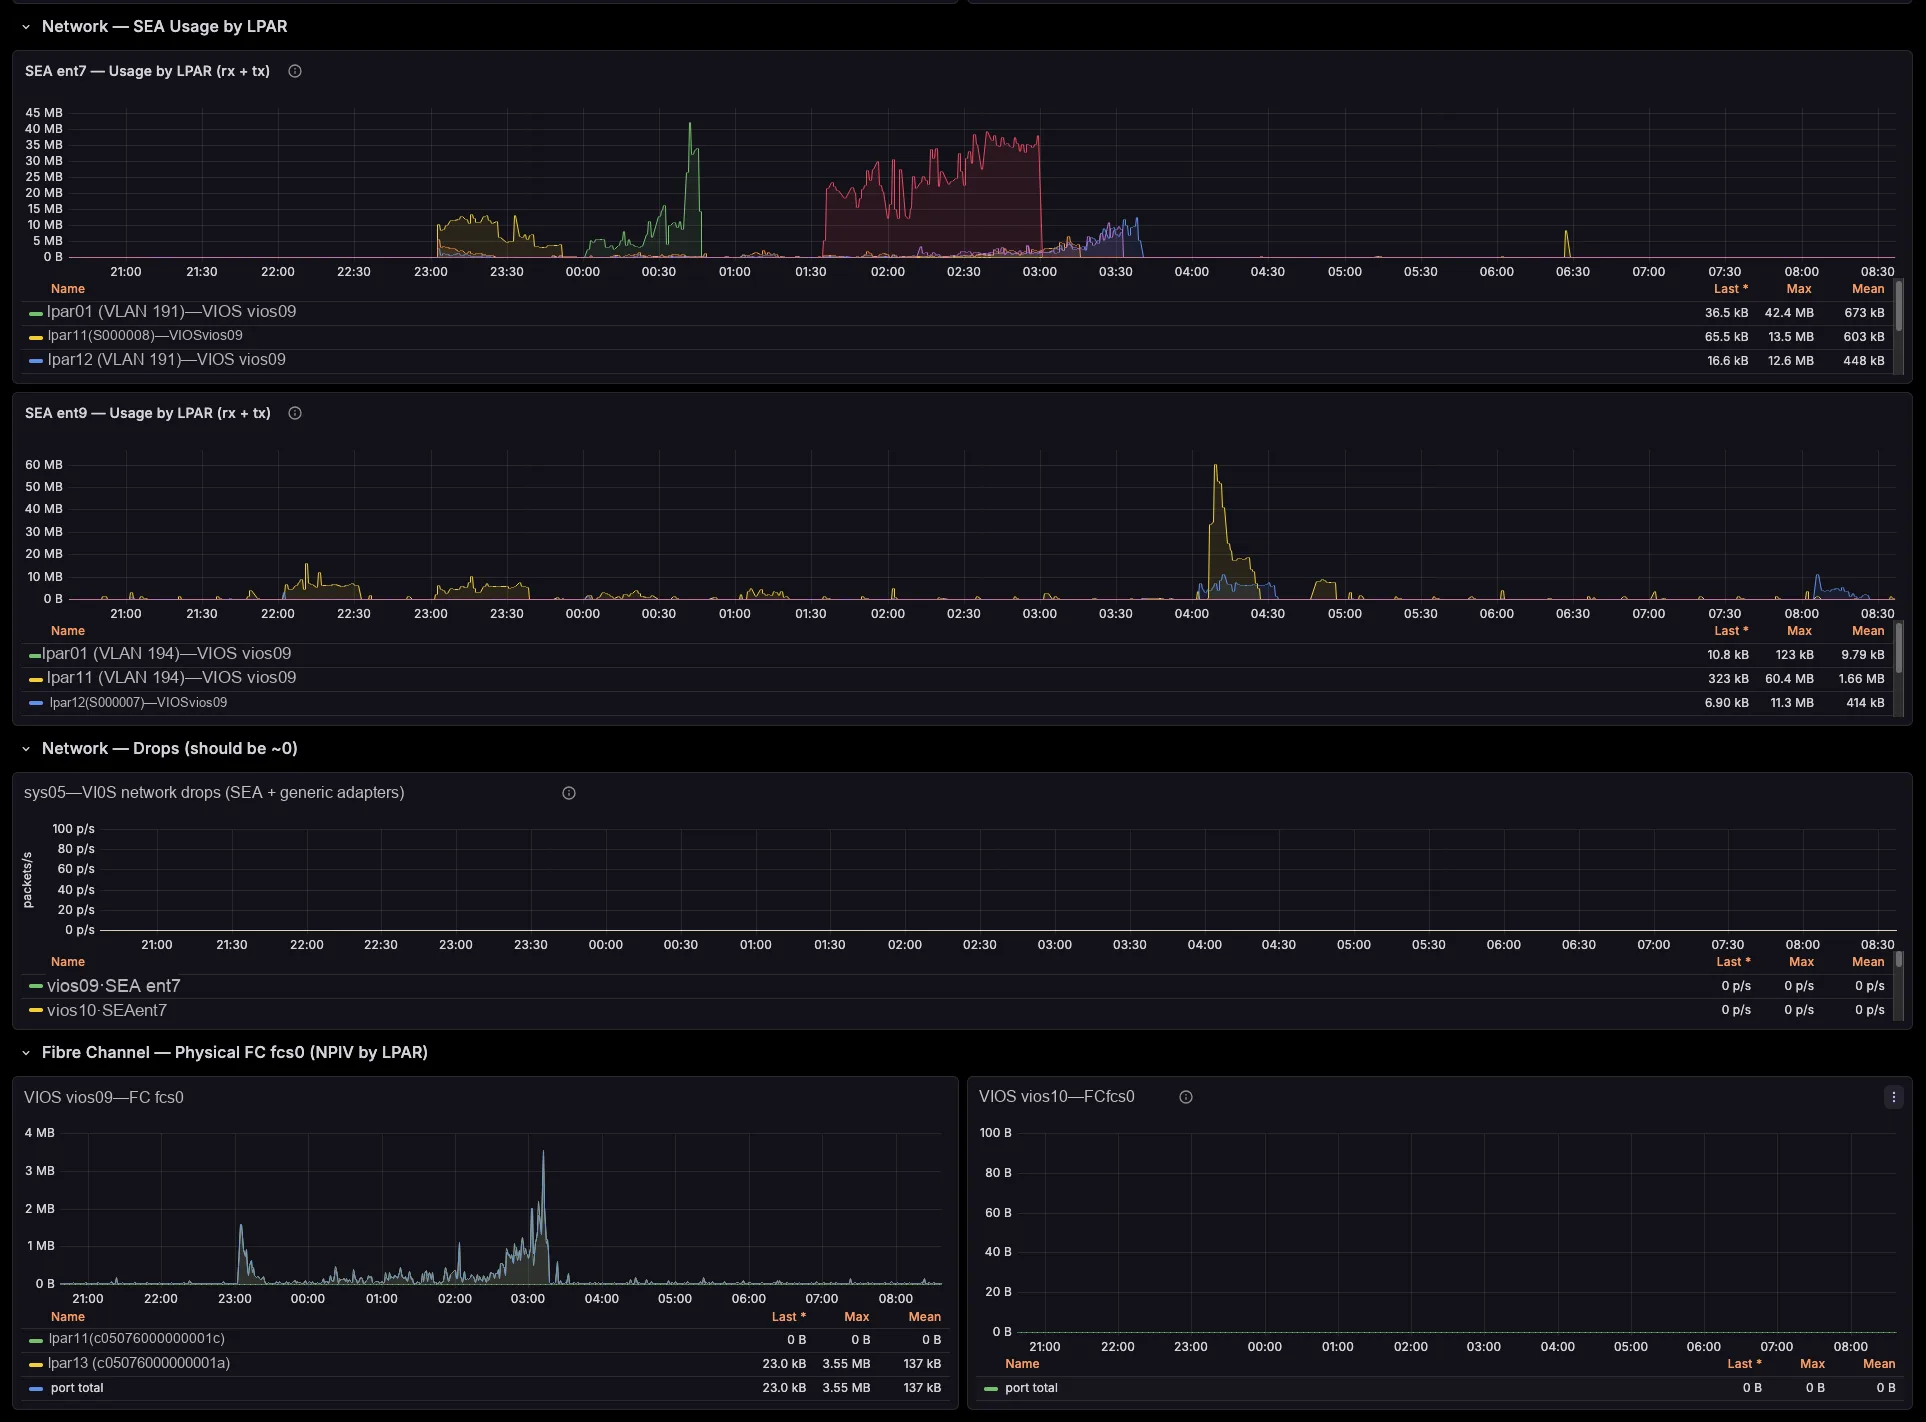
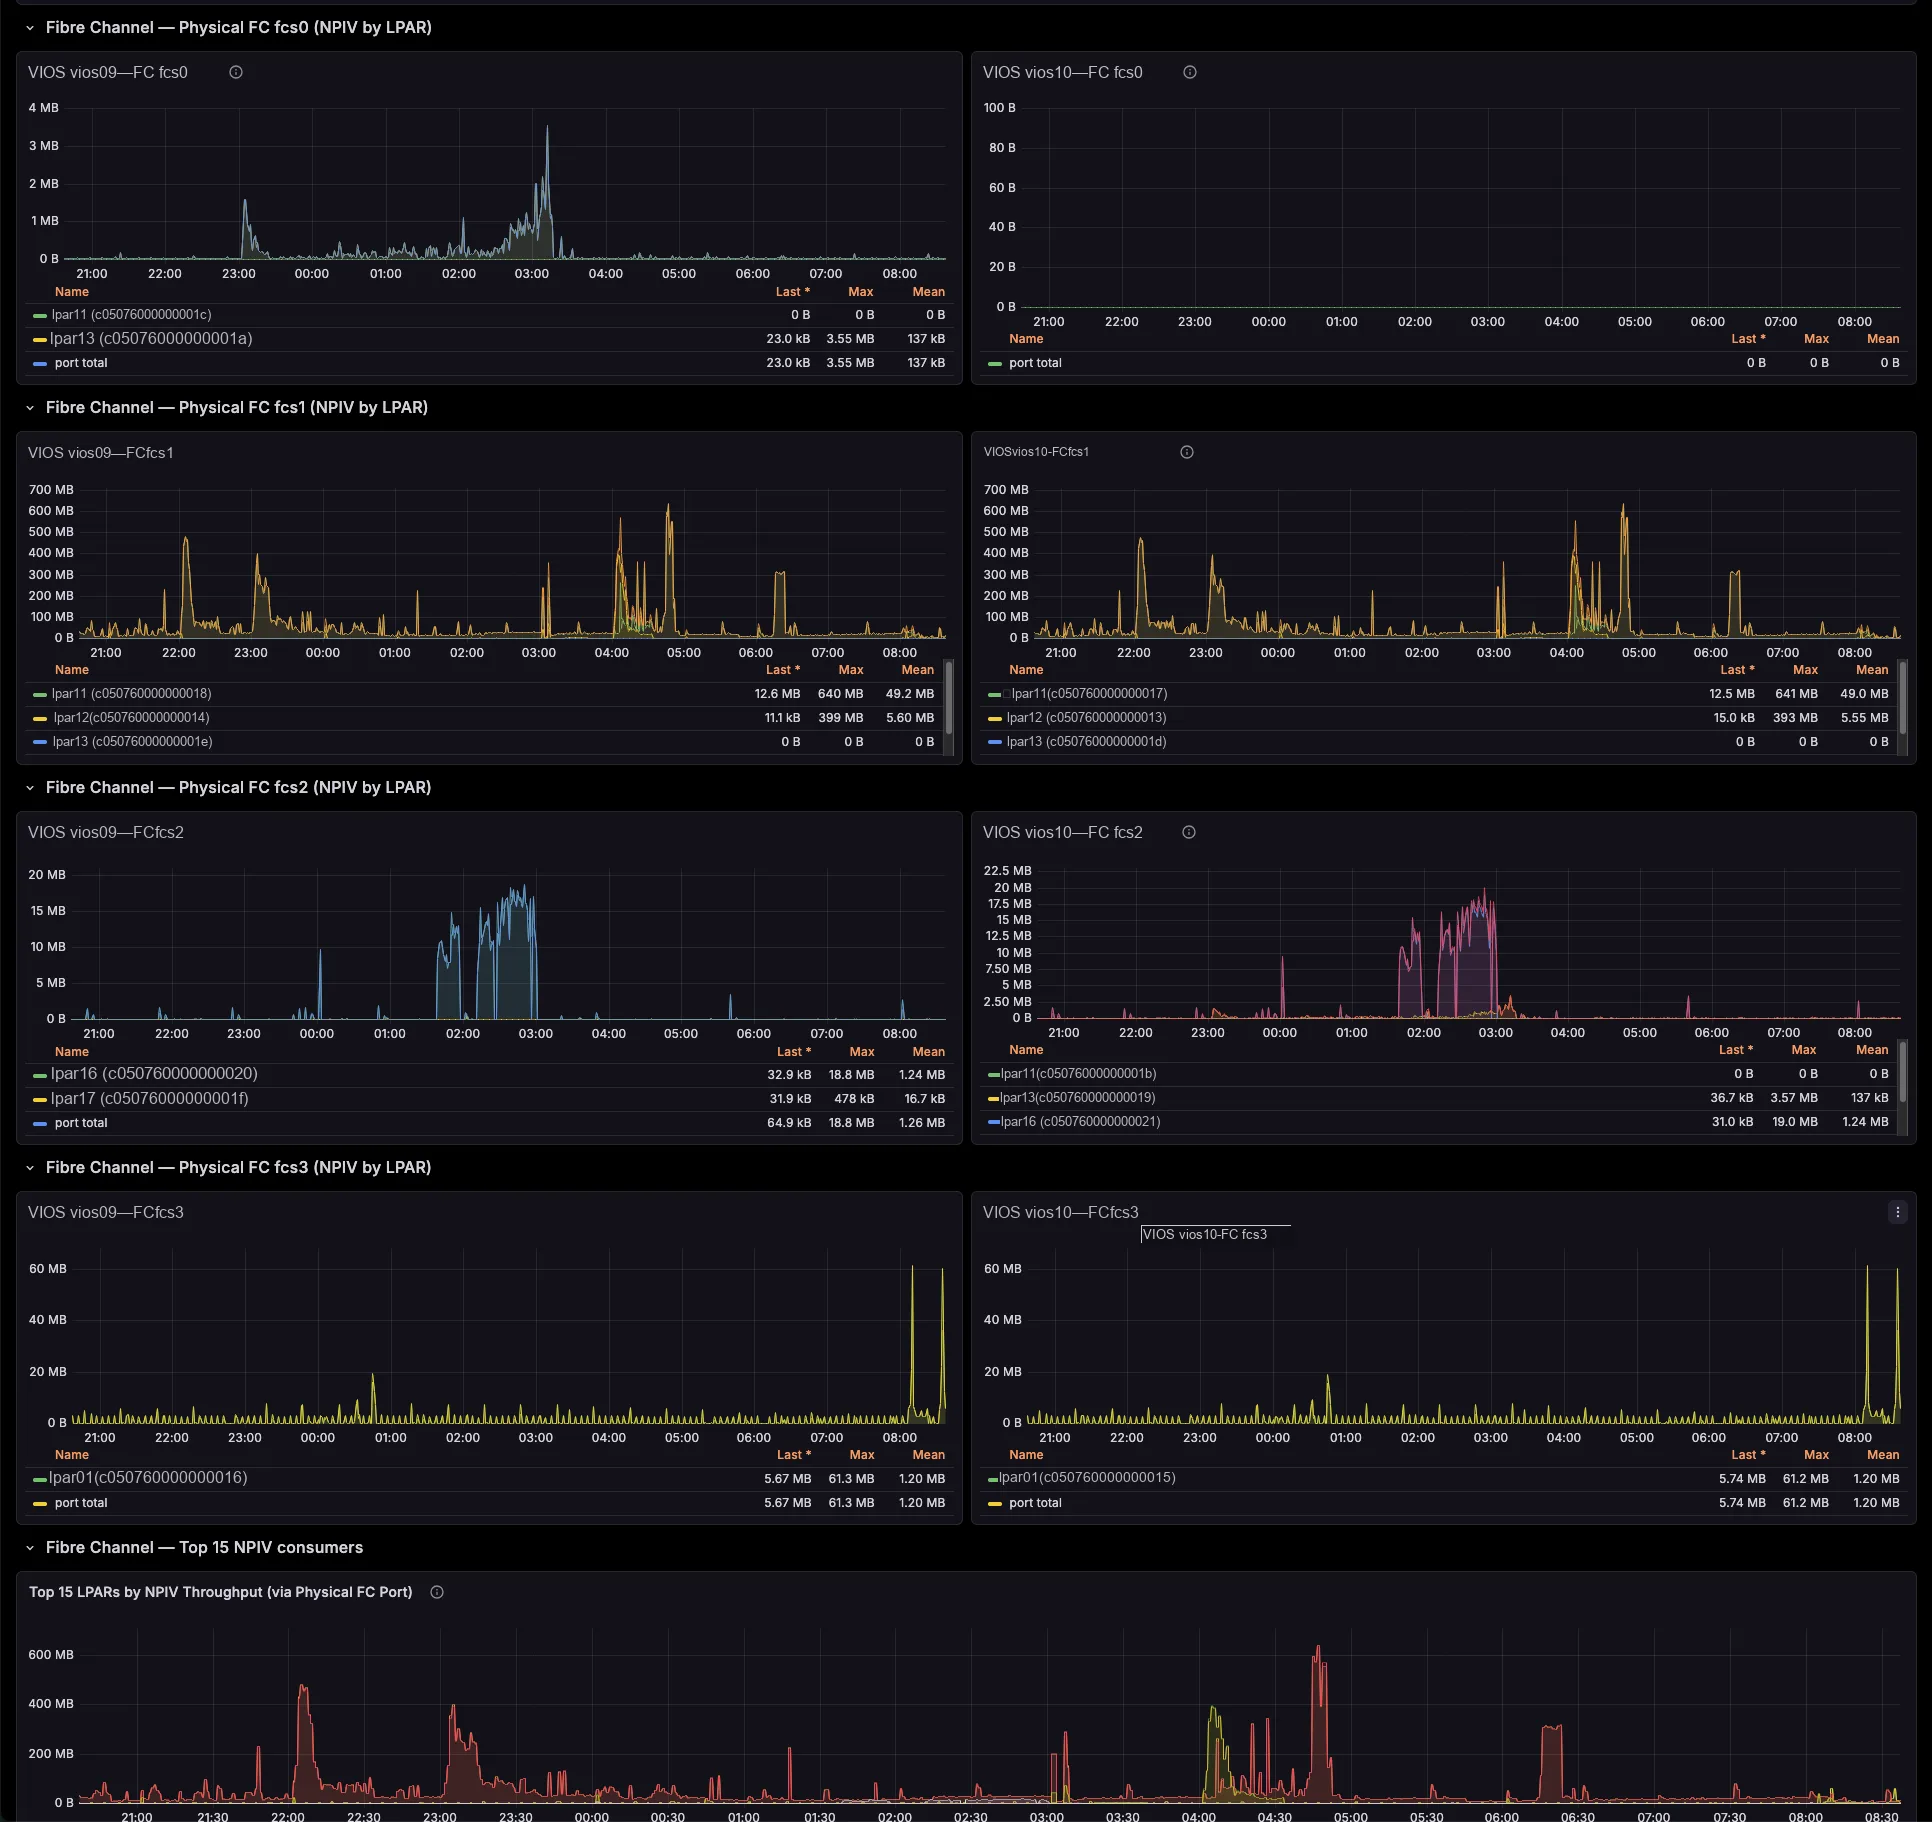
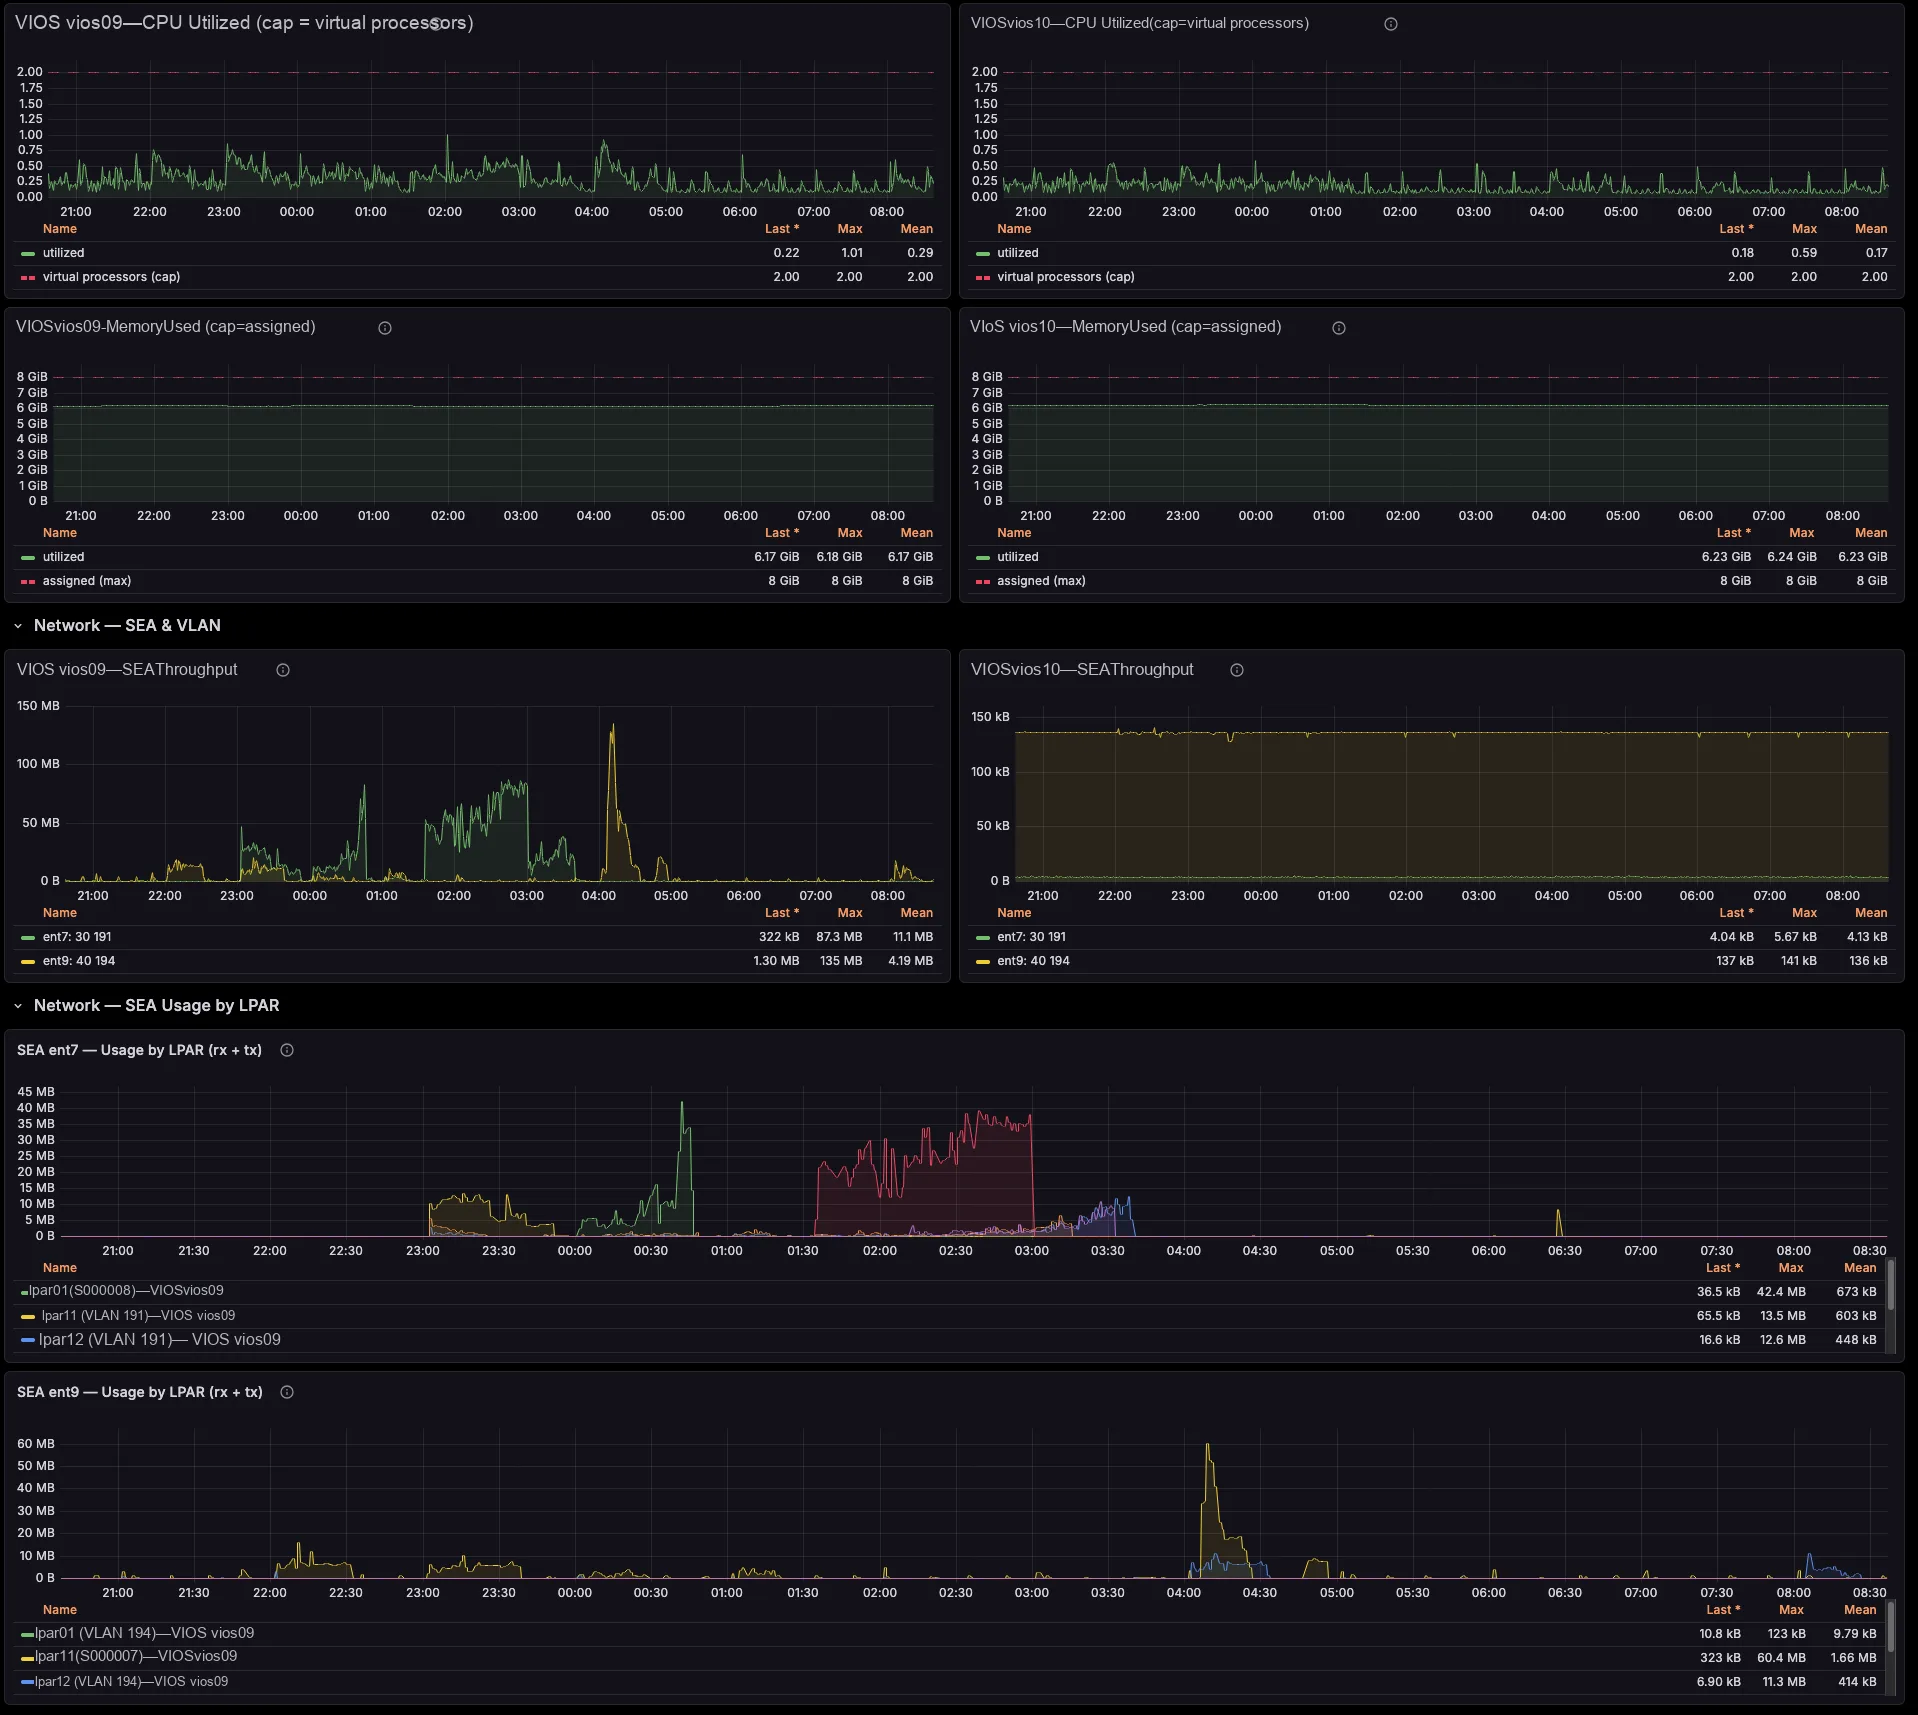
Each per-LPAR network and storage series already carries the serving VIOS — the primary SEA VIOS (which self-corrects on a SEA failover), the VIOS behind each NPIV physical port, and the vhost serving each VSCSI disk. So you need no id→name joins and no lsmap archaeology. Better still, a built-in noisy-neighbour view surfaces the VIOS uplinks each critical LPAR actually depends on.
# the serving VIOS, SEA and VLAN are on the series itself —
# no join against lsmap / lshwres needed
power_hmc_lpar_network_received_bytes{
  system="sys01", lpar="lpar07",
  vlan_id="191", sea="ent10",
  vios="vios02"} 4.81e+08

power_hmc_lpar_vfc_read_bytes{
  lpar="lpar07", fc="fcs1",
  vios="vios02"} 1.66e+09
Network and storage, attributed to the LPAR
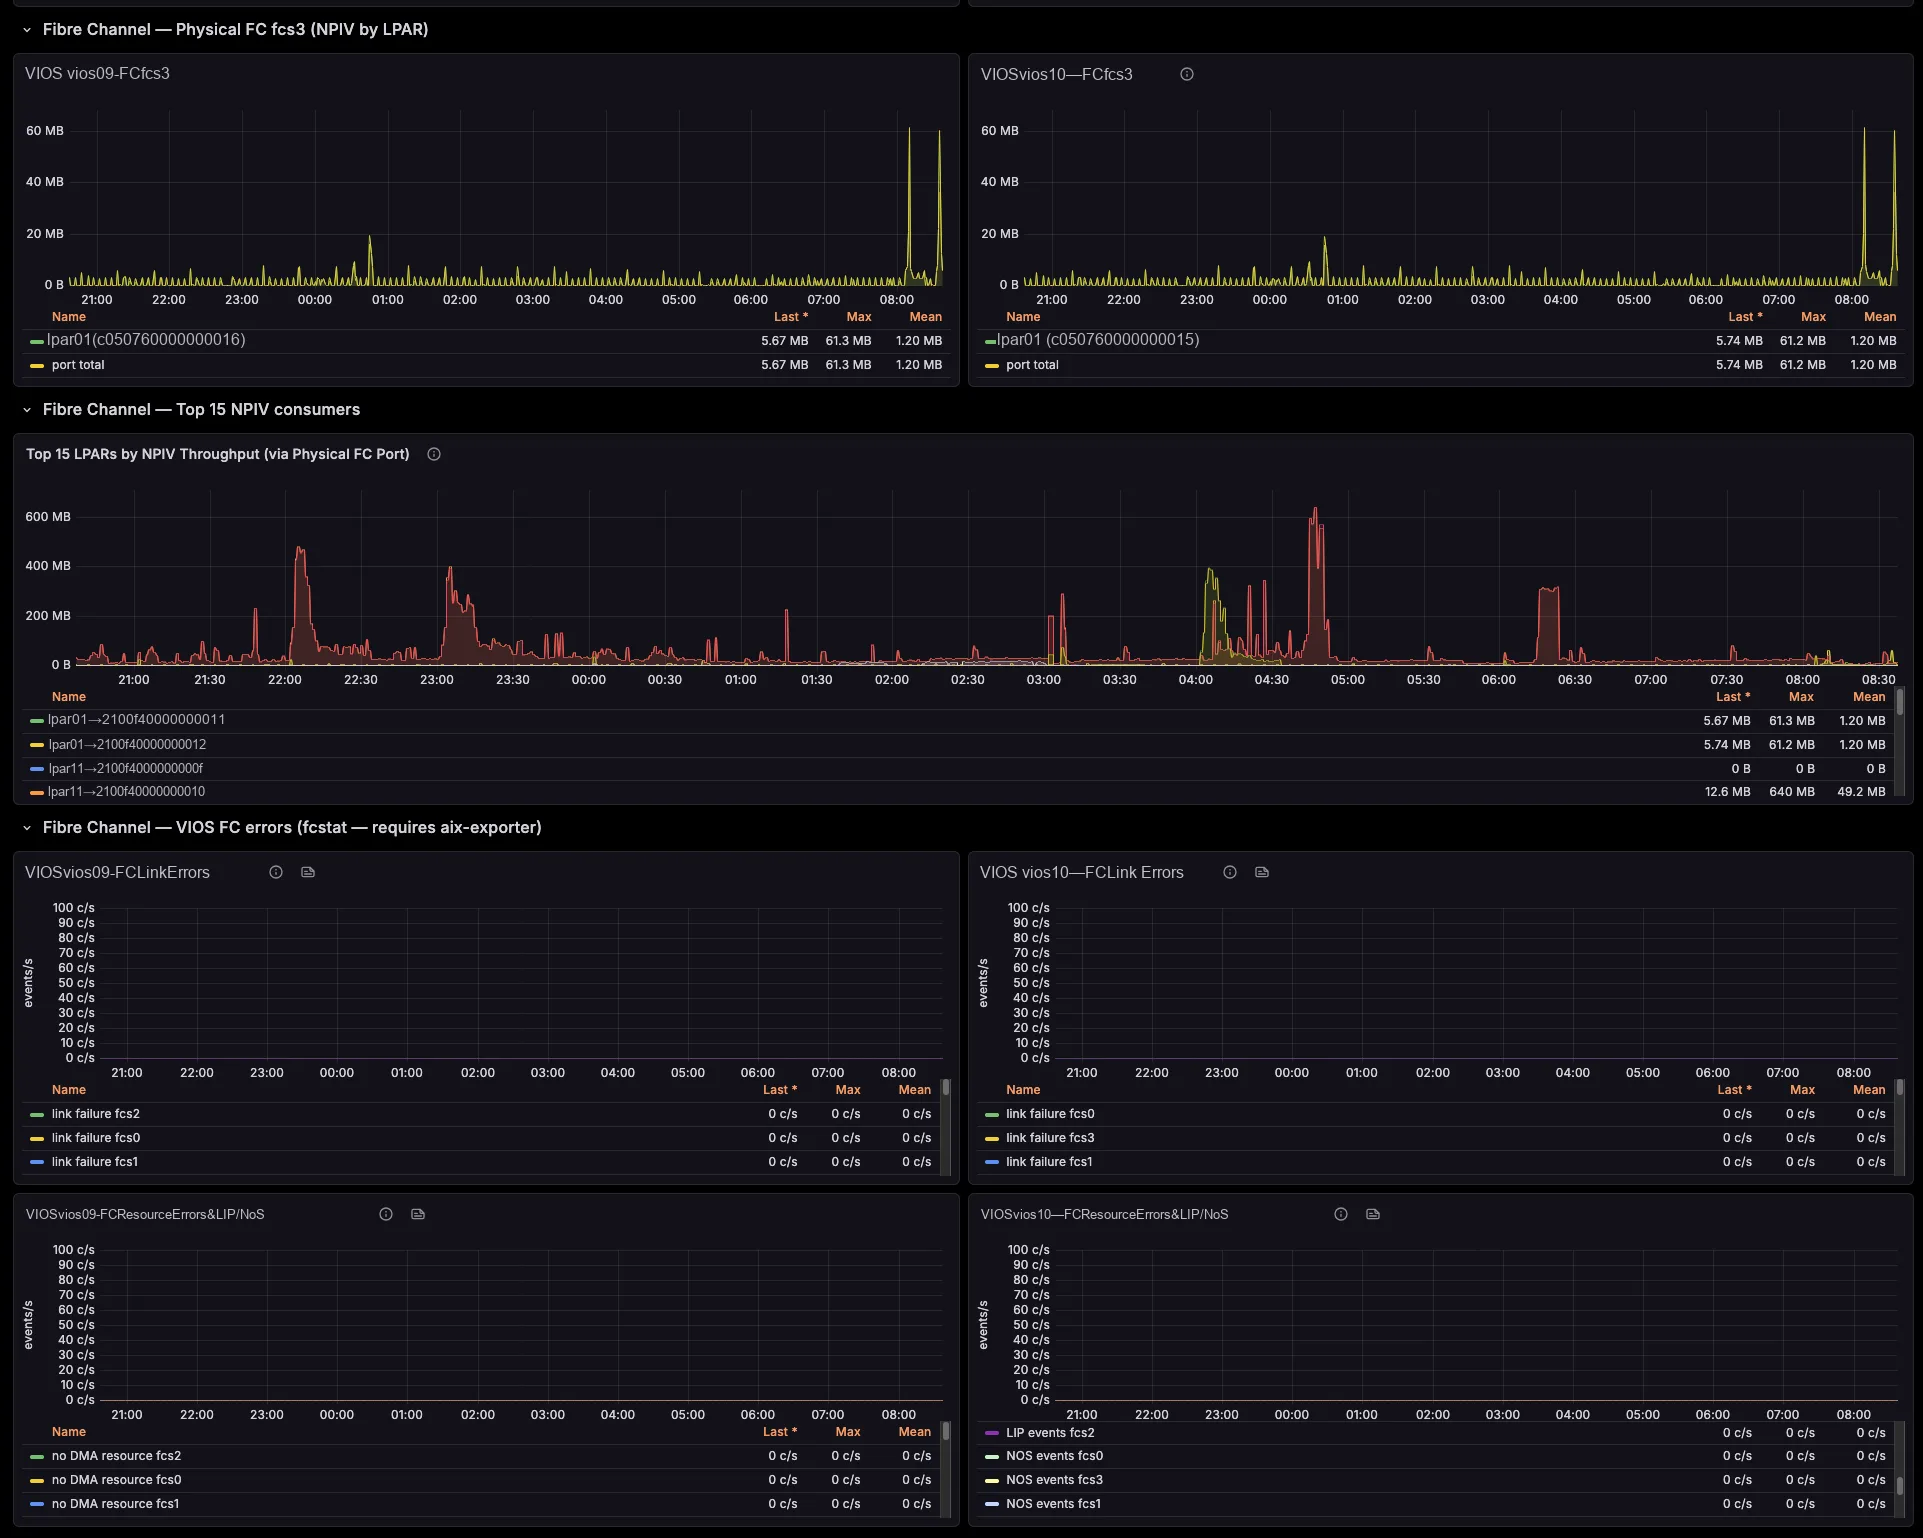
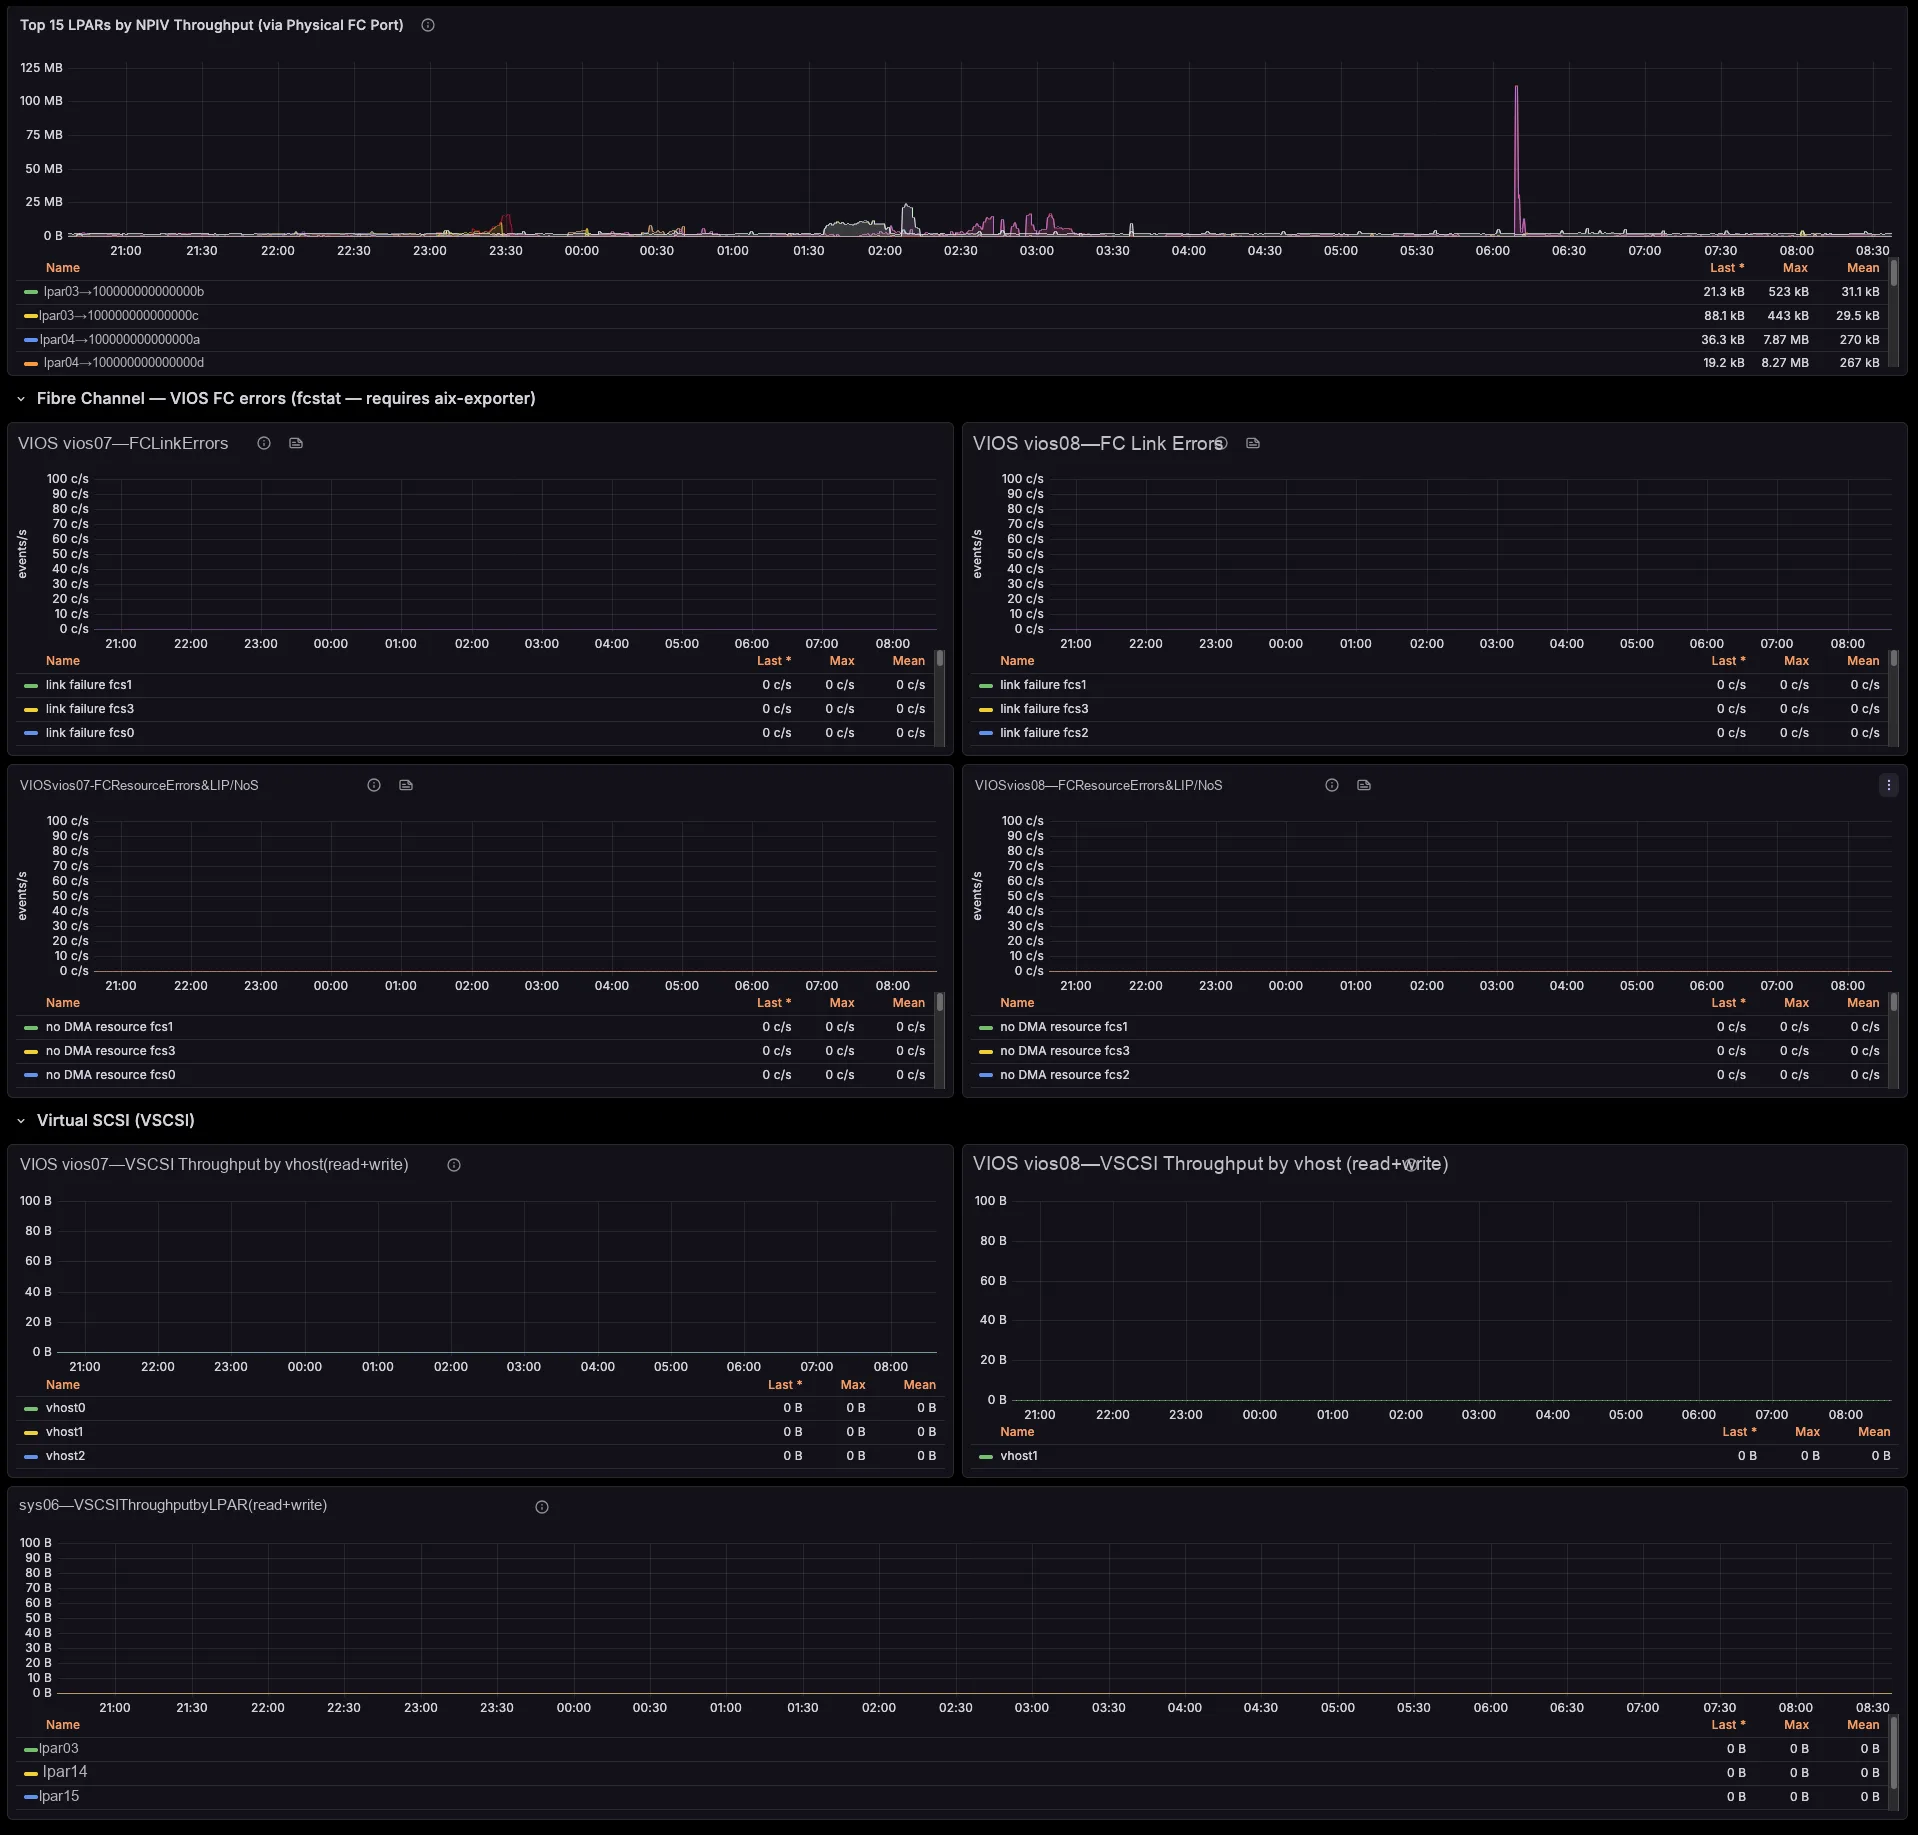
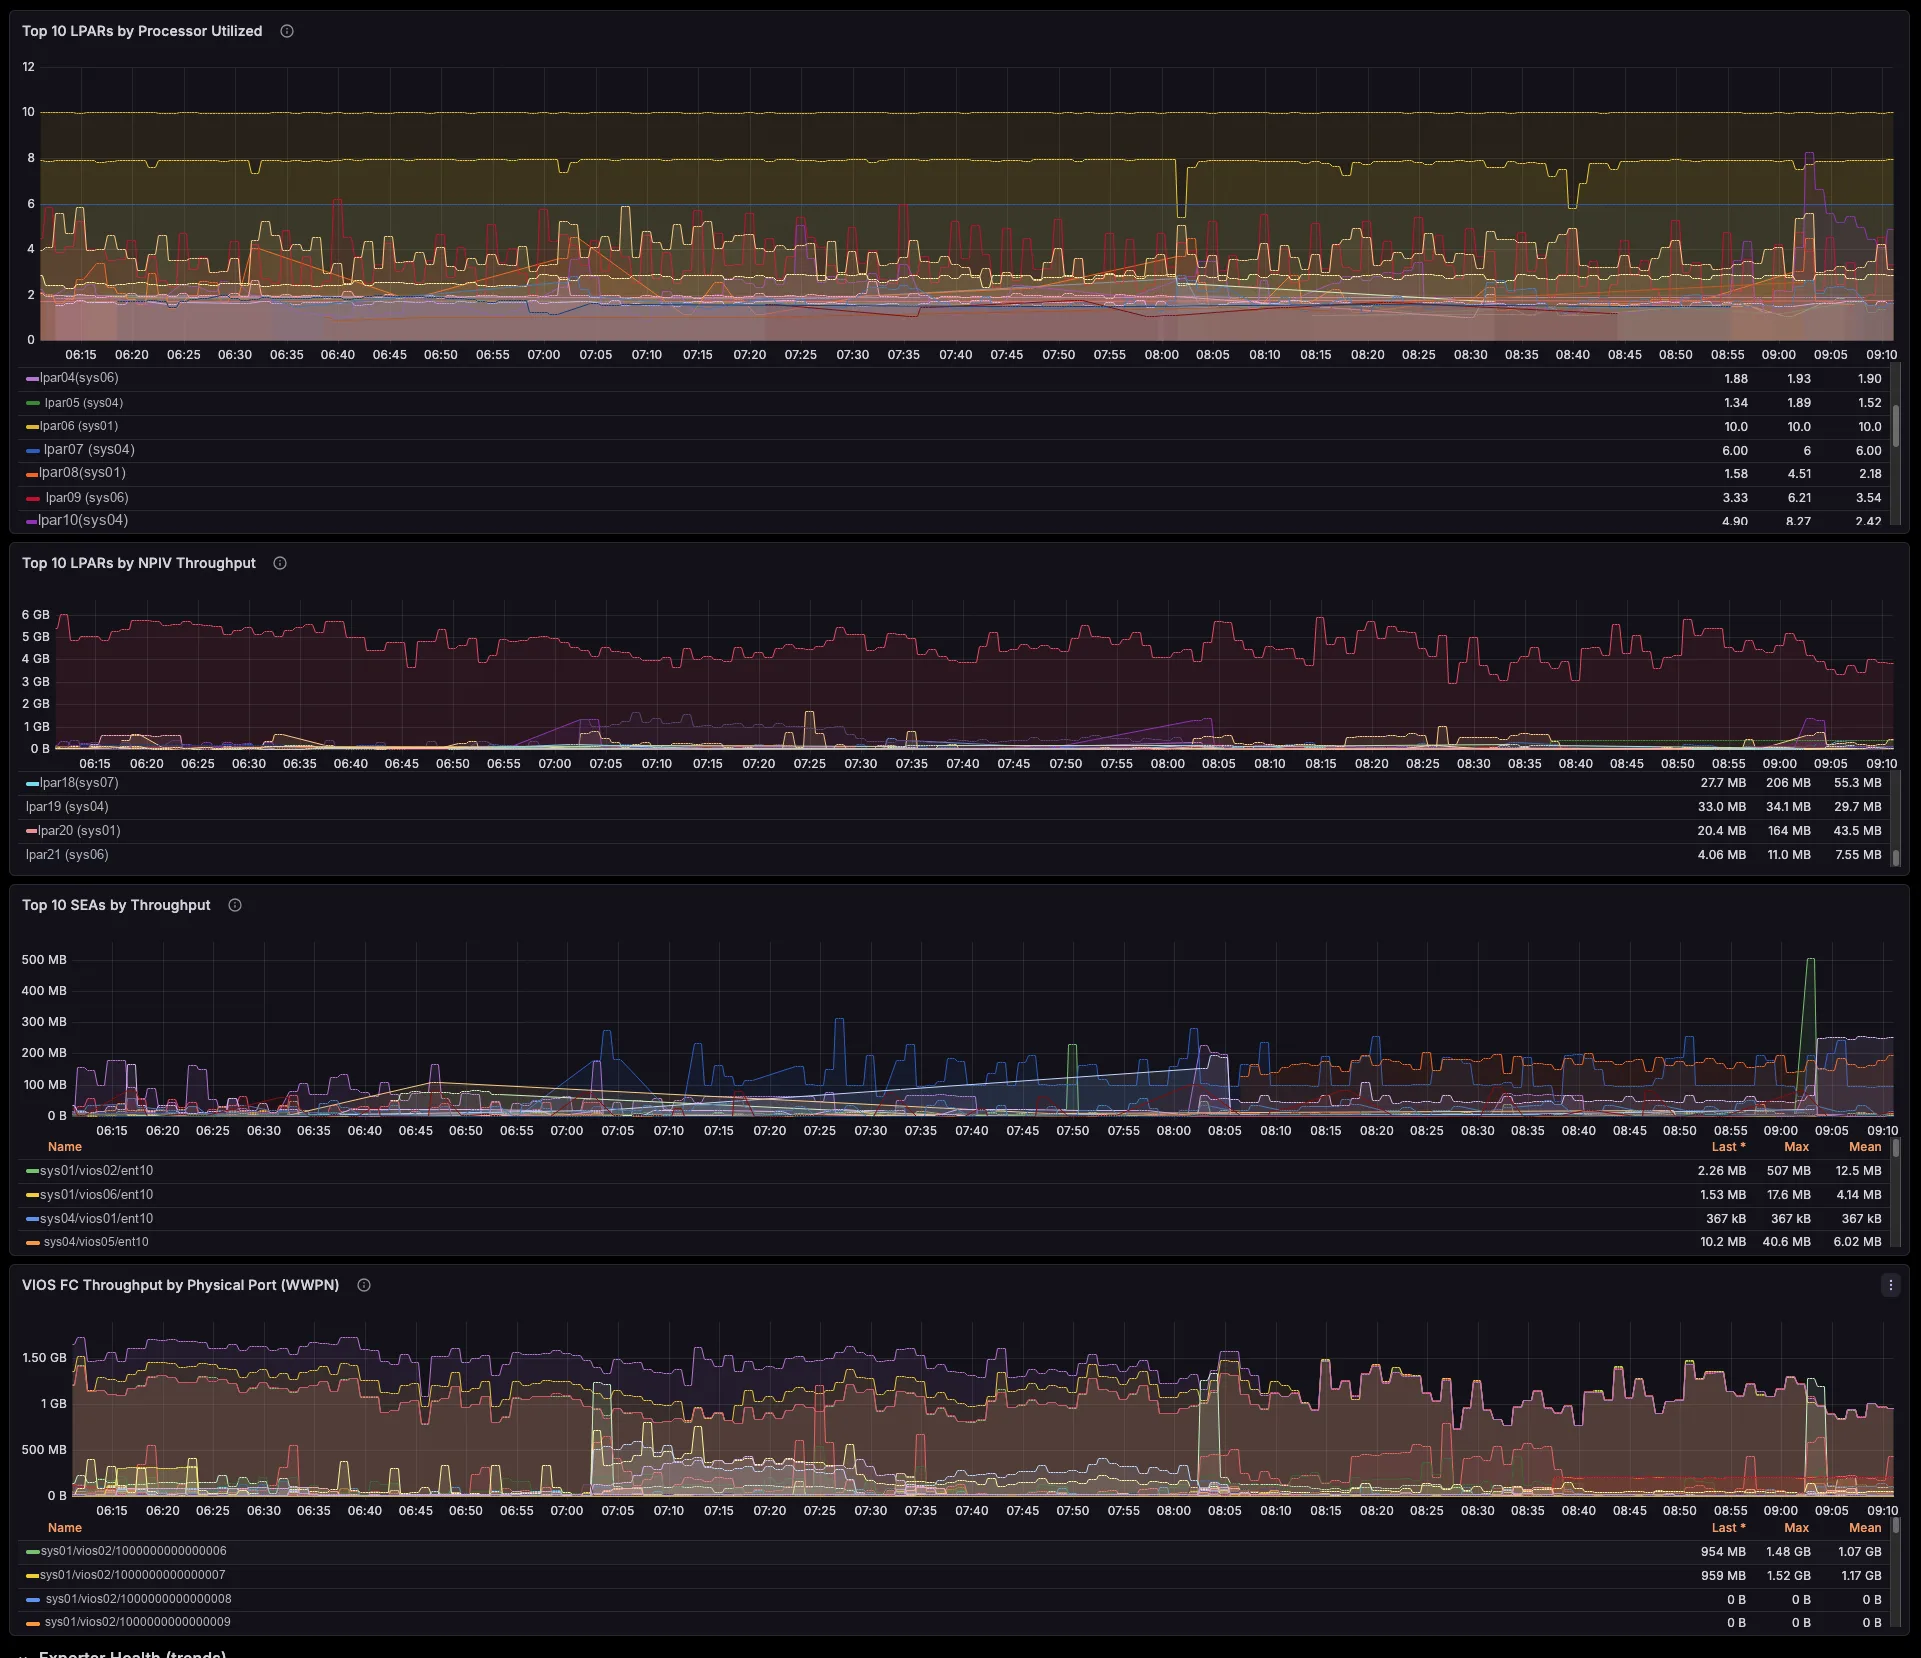
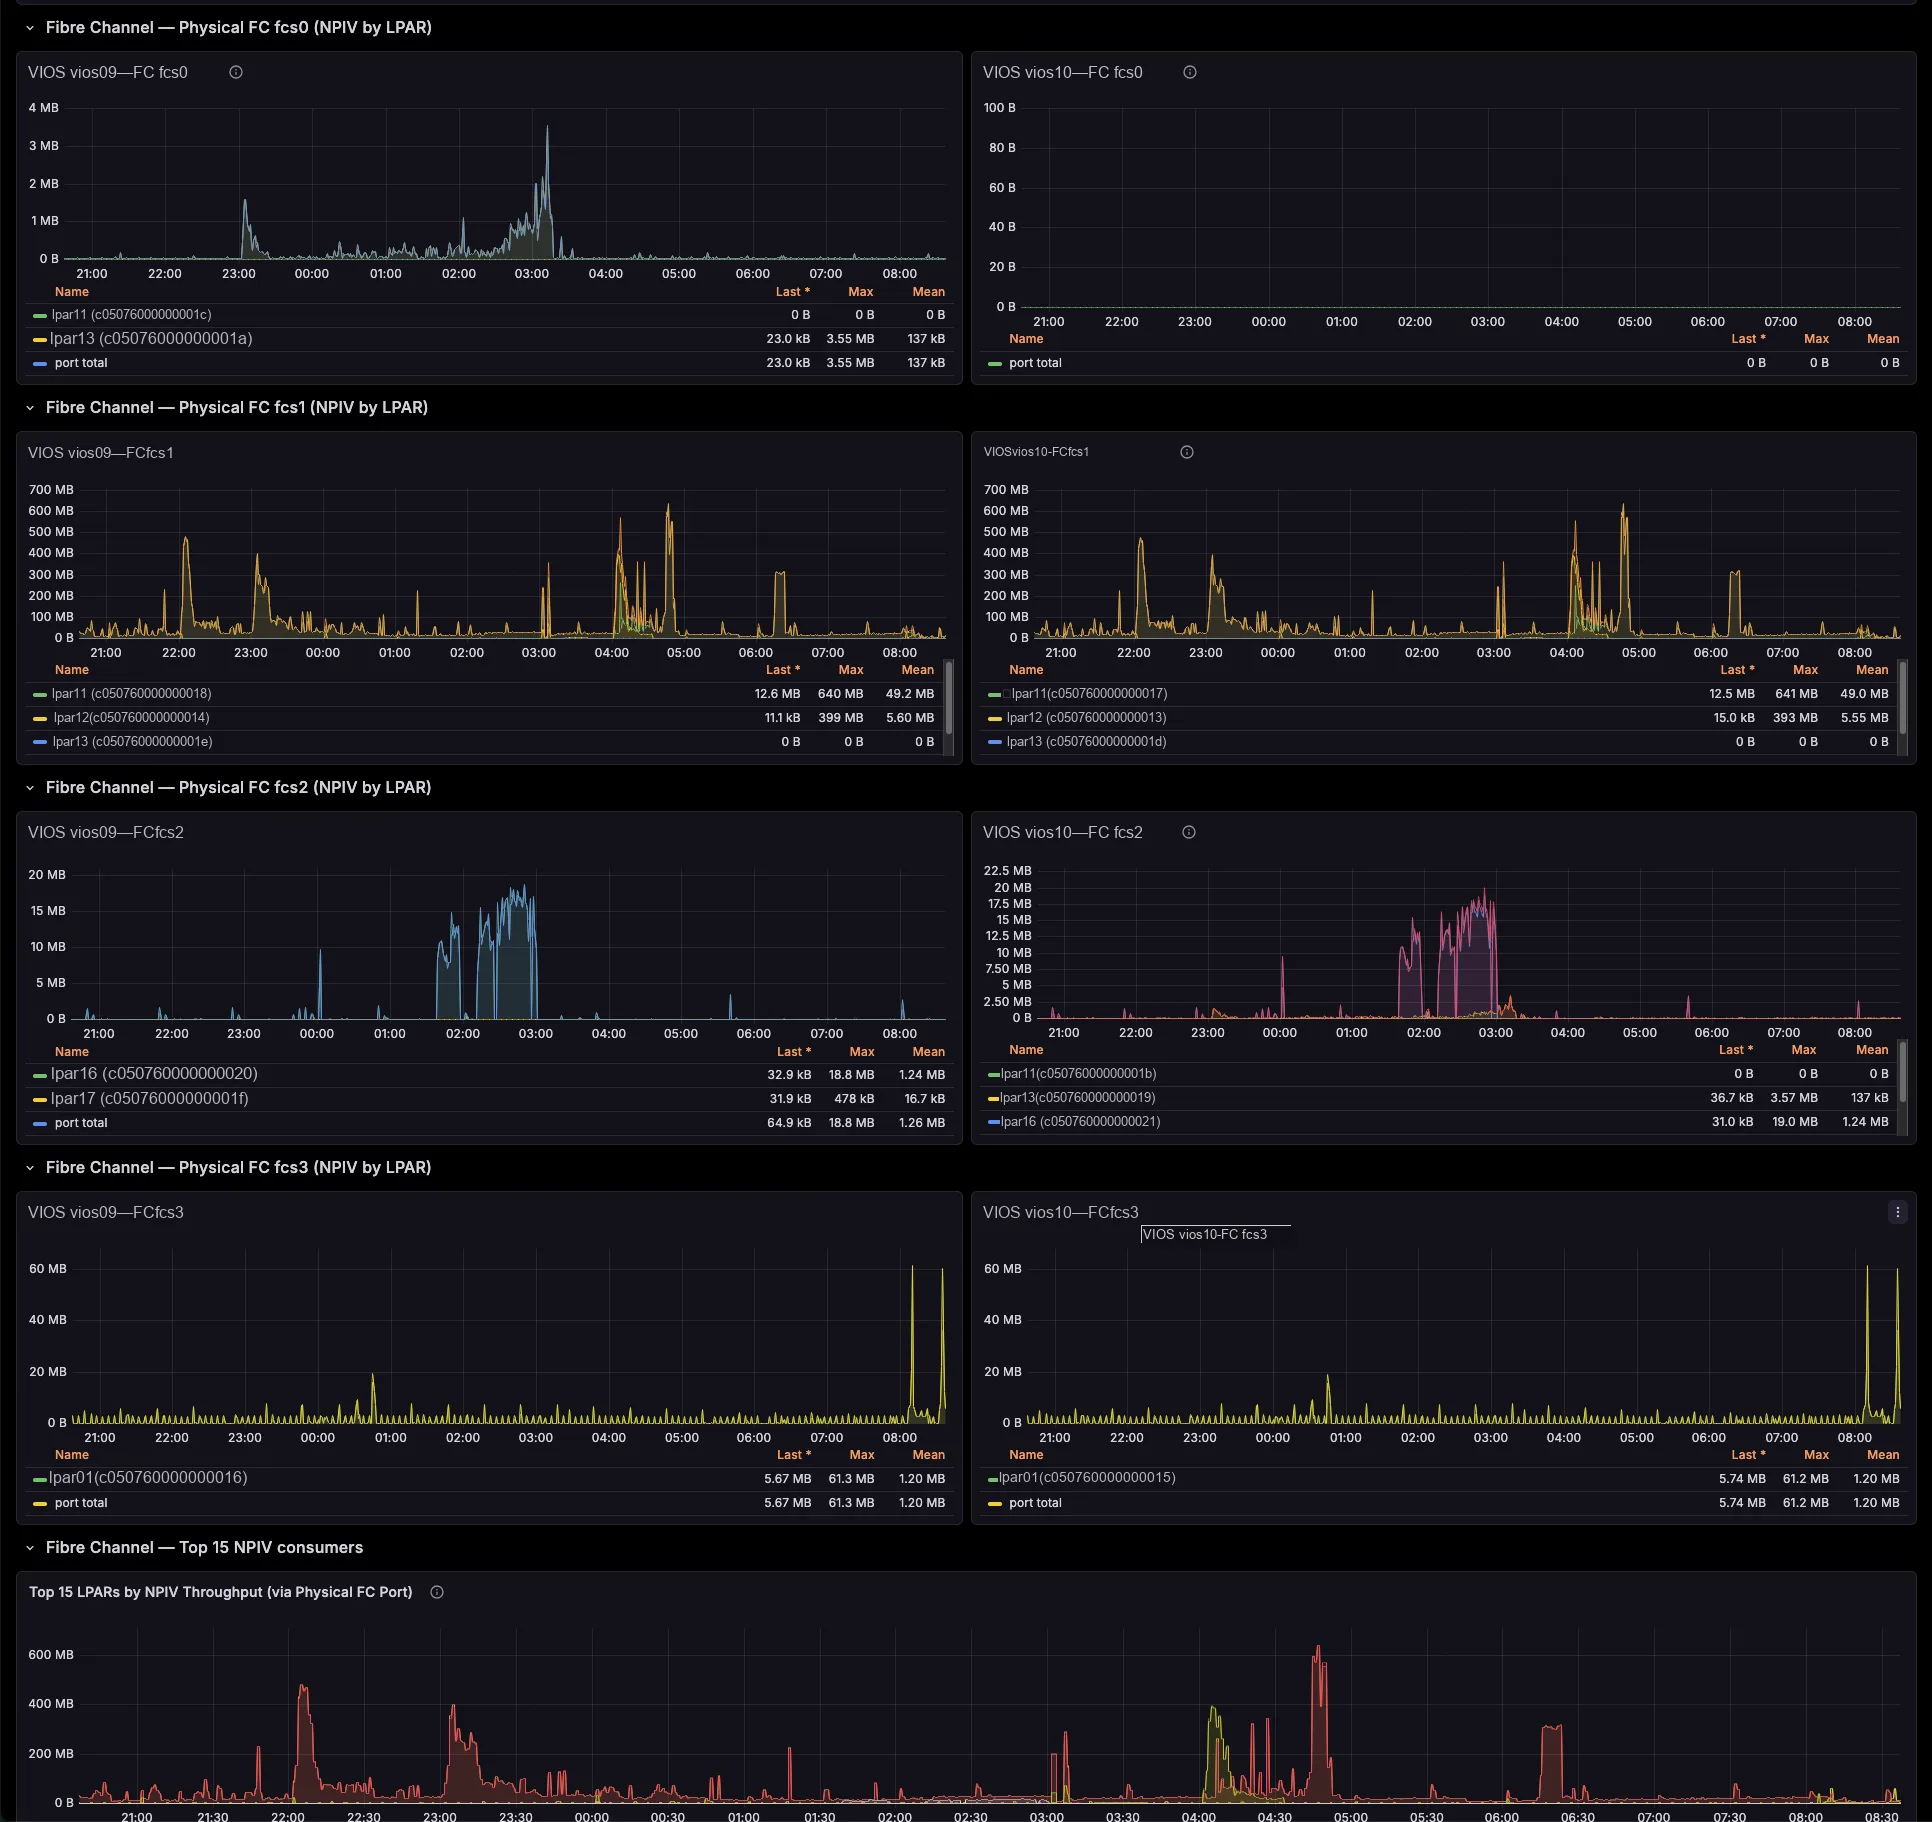
The exporter breaks SEA throughput down by the LPARs and VLANs riding it, maps NPIV virtual-FC traffic to the physical FC port and the VIOS that bridges it (with Top-N consumers per port), and ties VSCSI I/O to the serving vhost. So those cross-team questions that once needed a war-room — “who is saturating fcs1?”, “which LPAR is flooding this SEA?” — you now answer on a single screen.
Hours of correlation become seconds on a dashboard
Therefore you drill from a pool, SEA or FC-port spike straight to the offending LPAR and the VIOS that bridges it — in seconds, not an afternoon of topas, lsmap and fcstat. You right-size pools and entitlements with evidence, you charge back shared-adapter usage per LPAR, and you cut the back-and-forth between your AIX, network and storage teams. And because one central exporter polls the HMC, you install nothing on your partitions.
Three Grafana dashboards, included
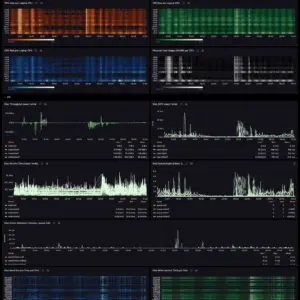
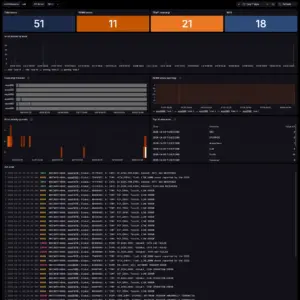
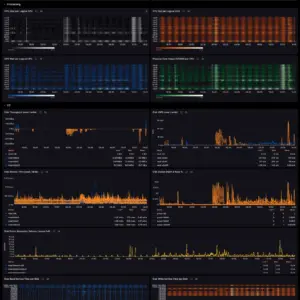
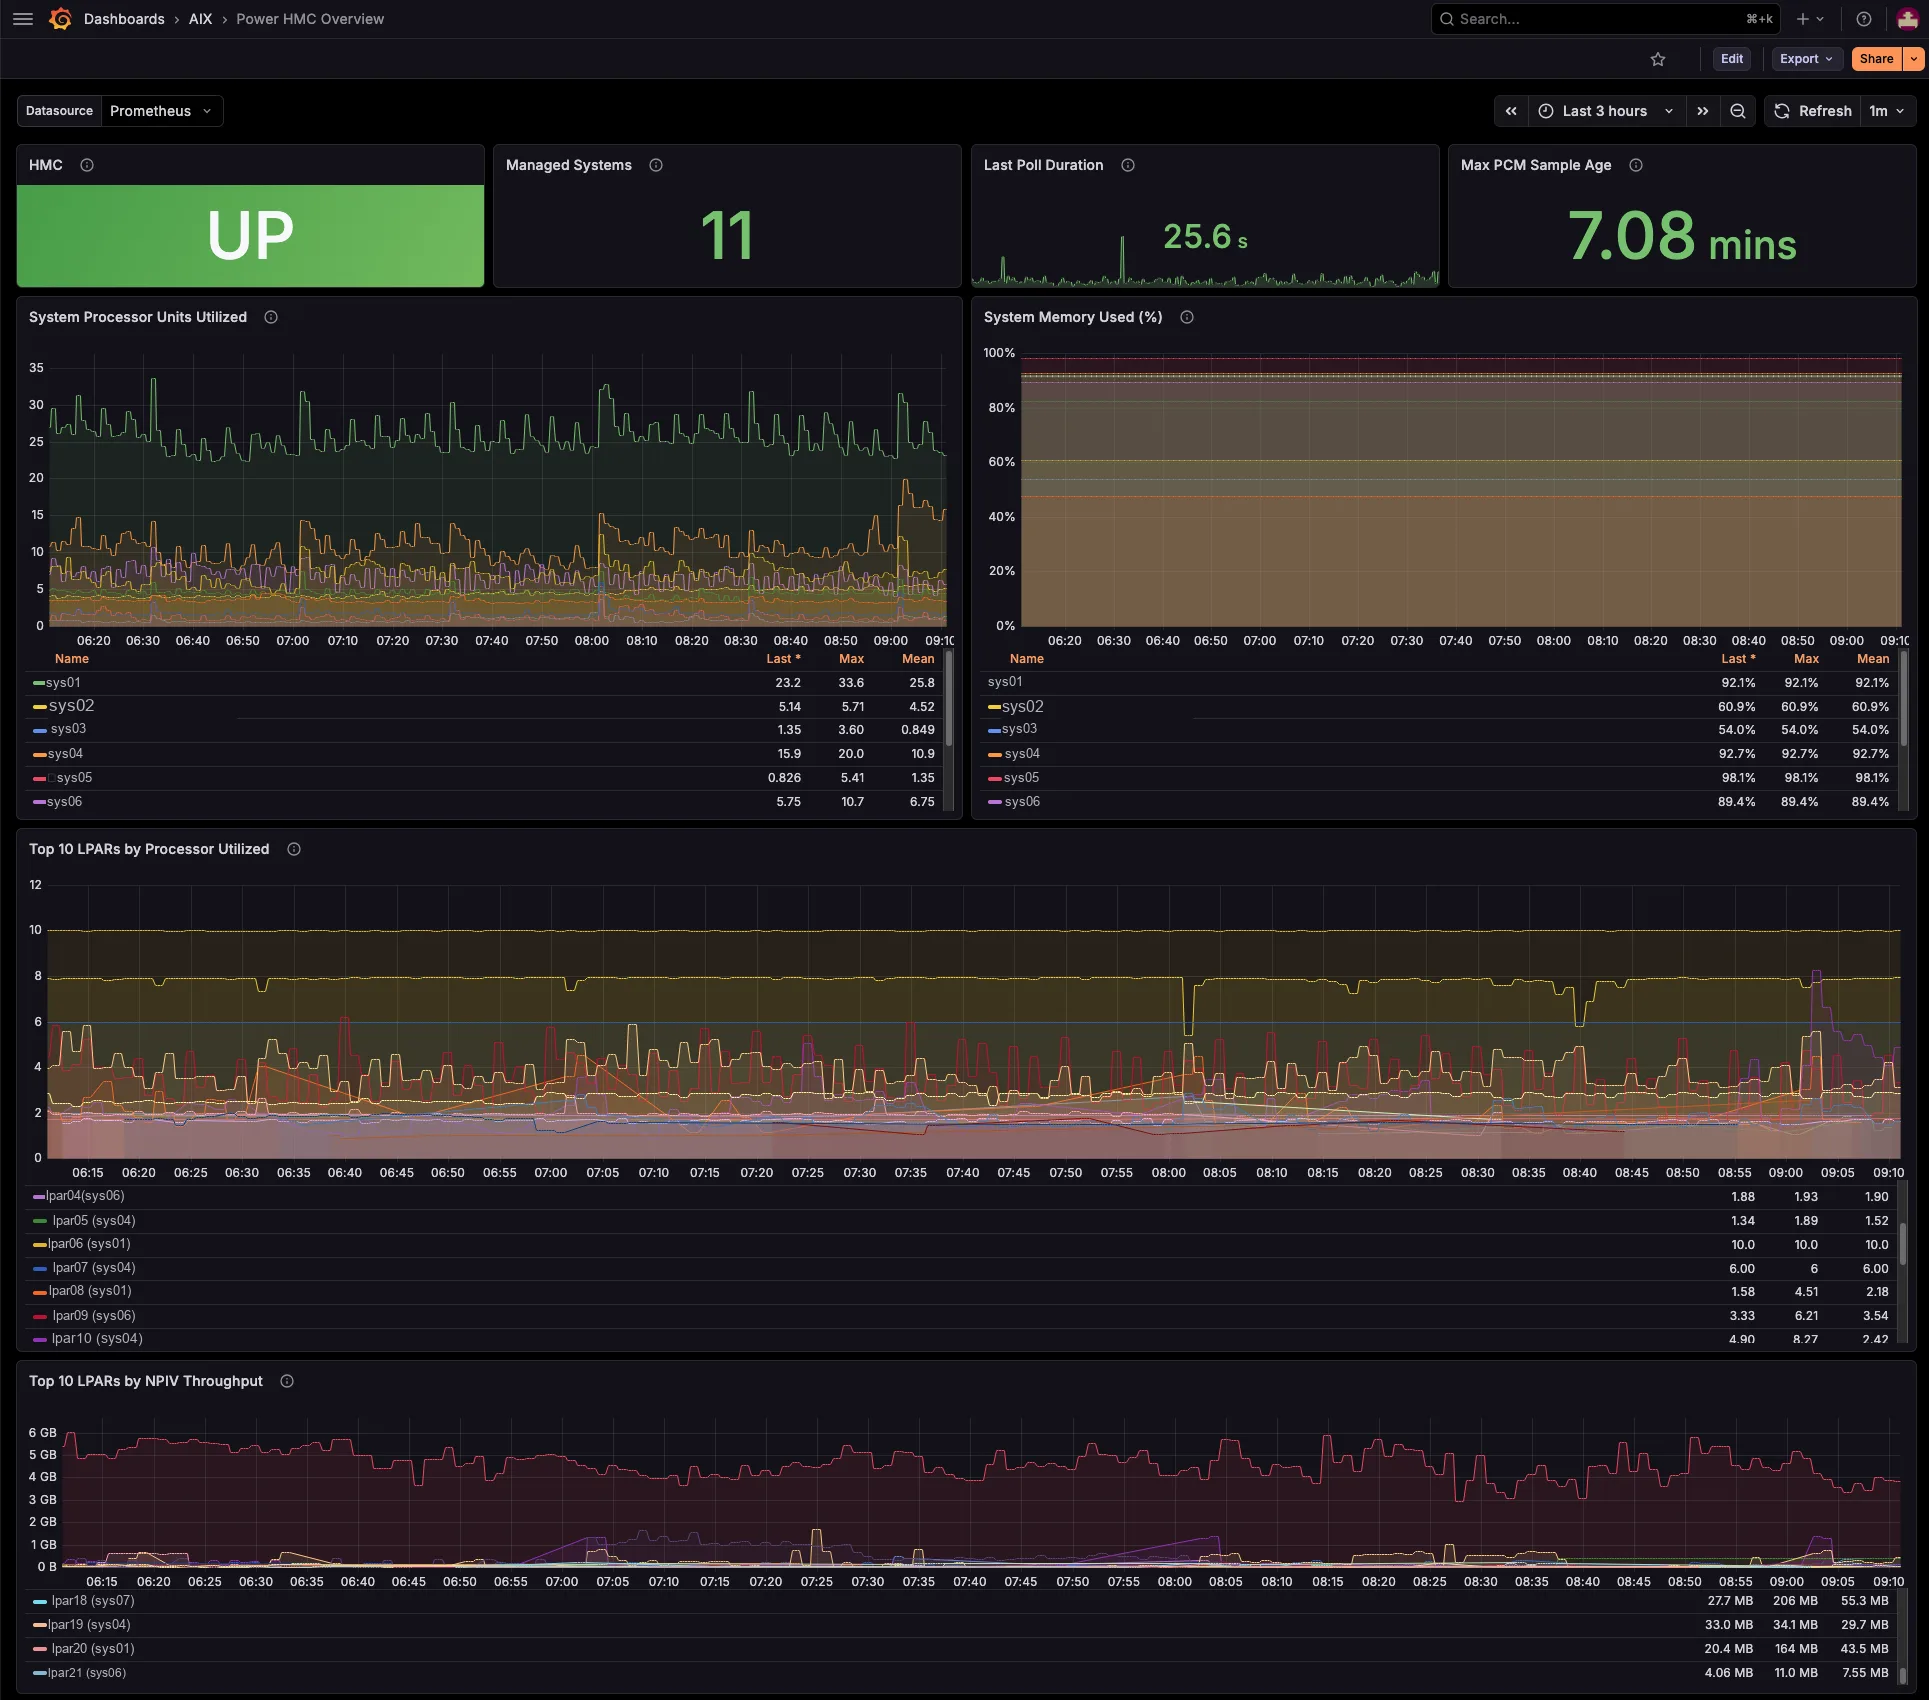
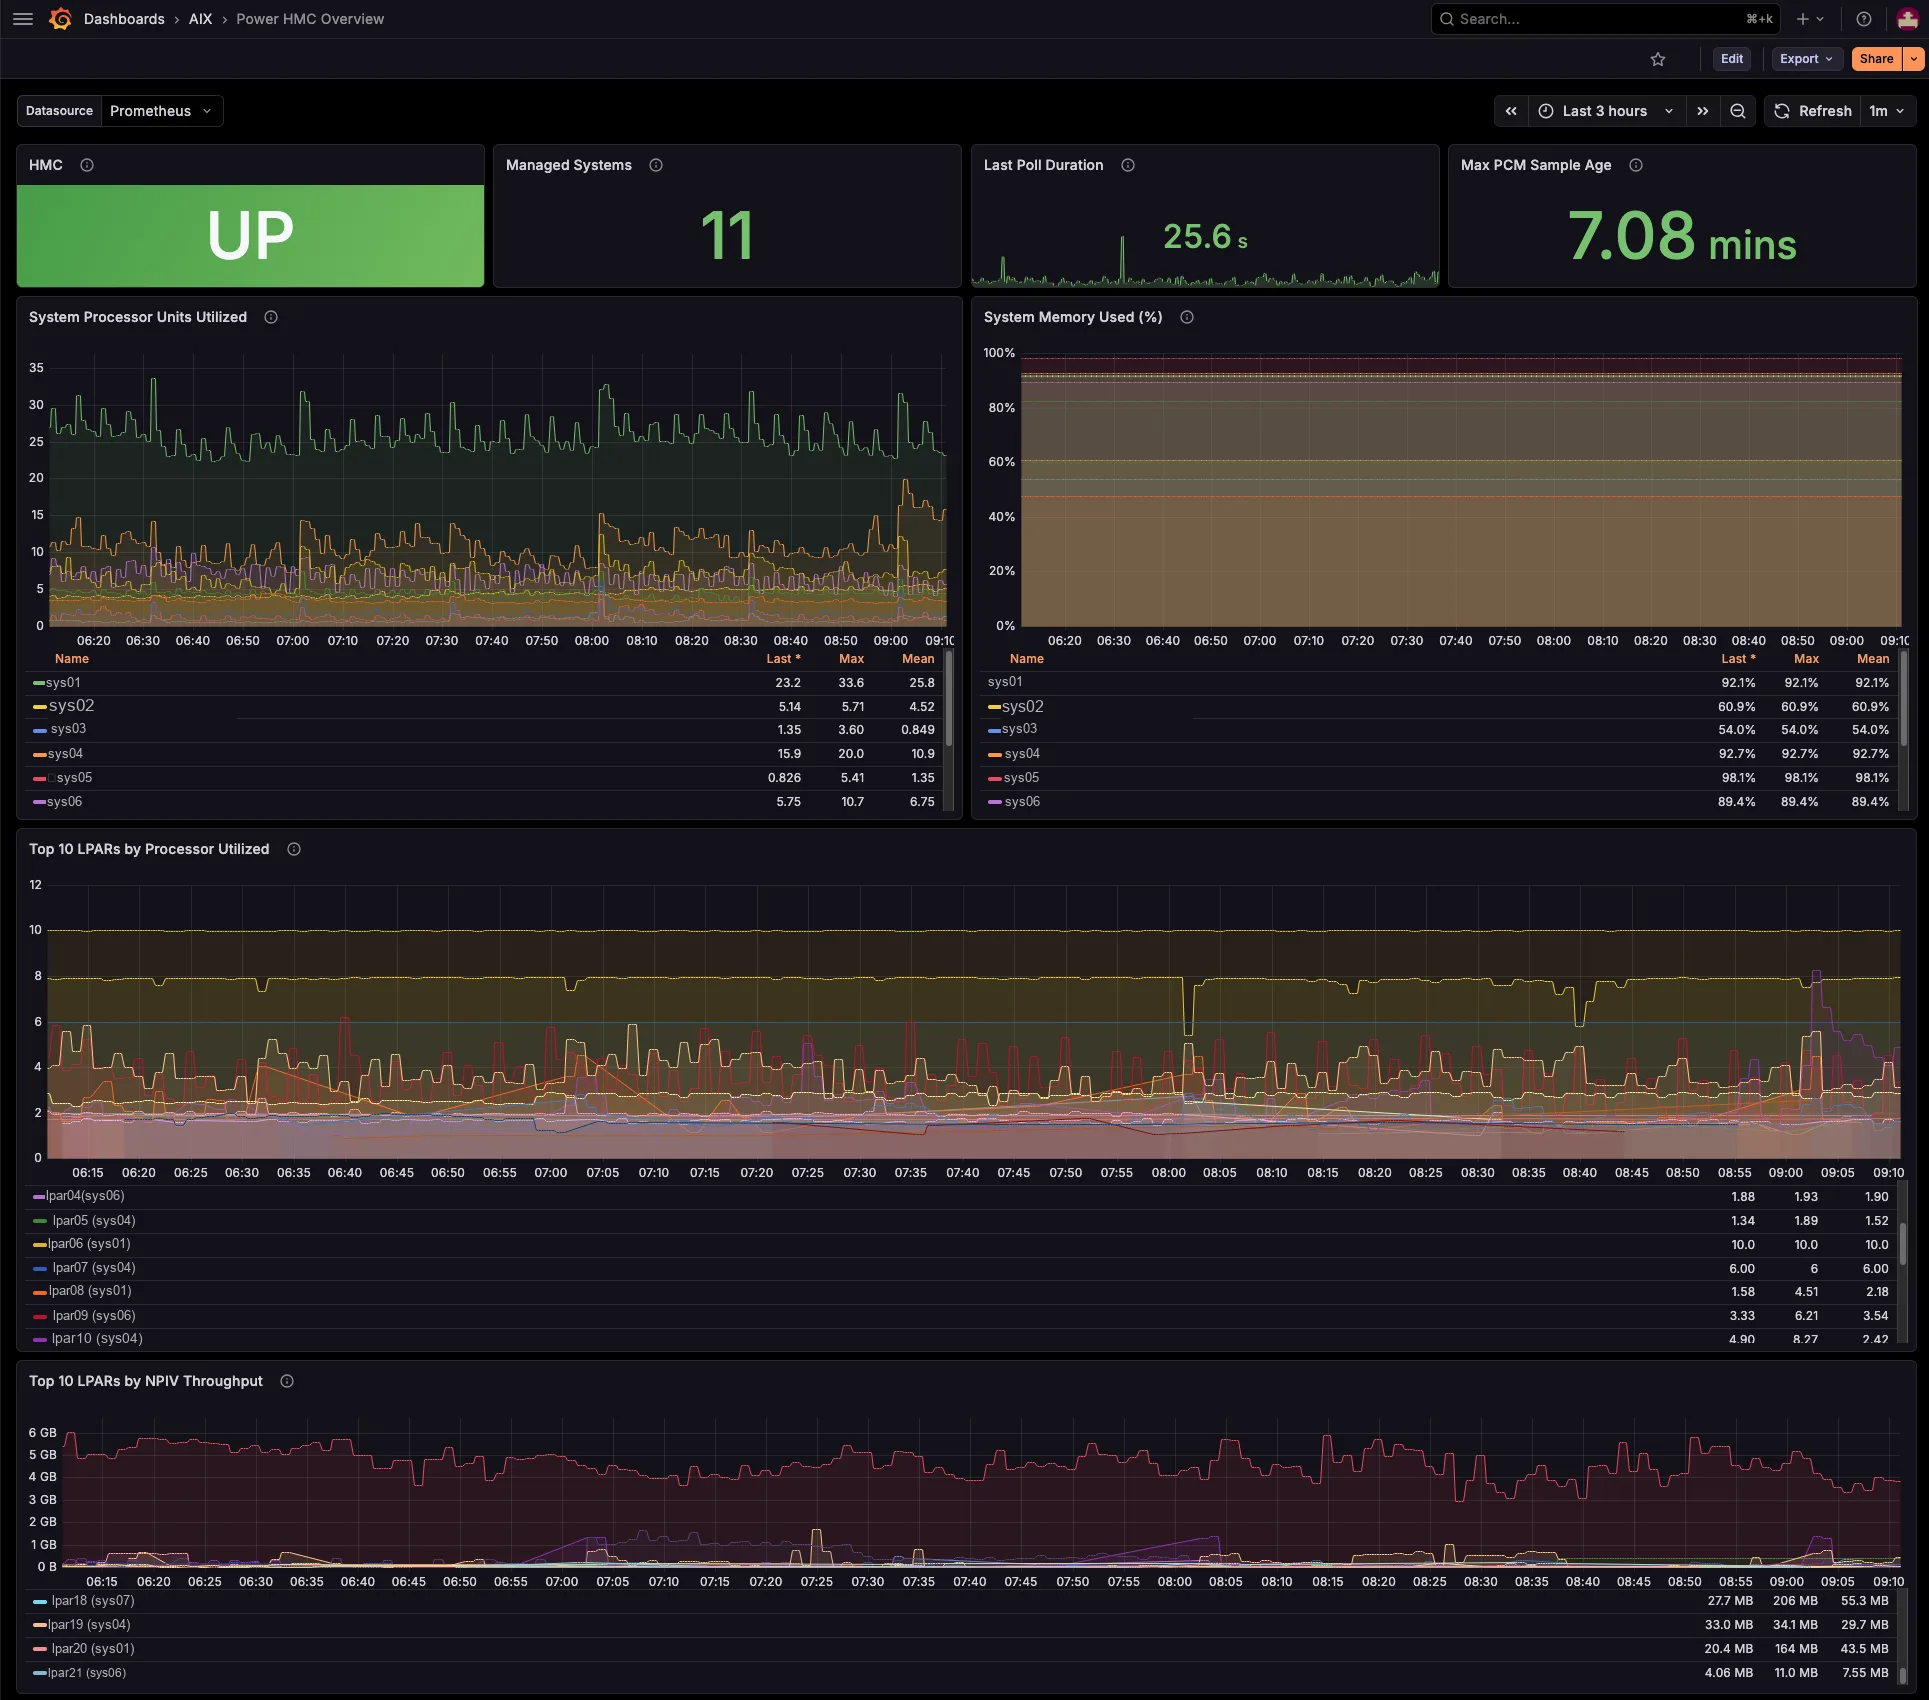
Three ready-to-import dashboards ship in the package. So you just import the JSON, pick your Prometheus datasource, and you are done. From the estate-wide bird’s-eye view, down to a single managed system, and down to one partition and the VIOS it leans on.
Performance firefighting
Drill from a saturated shared pool, SEA or physical FC port to the exact LPAR responsible and the VIOS that serves it — across the whole estate, in seconds. So you stop correlating four tools by hand under pressure.
Capacity & right-sizing
Because you can see pool headroom, entitled-versus-consumed, uncapped borrowing and virtual-processor ceilings, you resize LPARs, rebalance shared pools and plan a hardware refresh with evidence — before contention bites.
Shared-adapter chargeback
Attribute SEA and NPIV throughput per LPAR and per physical port. Then turn shared VIOS network and SAN infrastructure into defensible per-tenant cross-charges, with real time-series data behind every number.
Cross-team clarity
One source of truth that the AIX, network and storage teams can all read. The dashboards lay out the LPAR ↔ VIOS ↔ SEA ↔ FC-port chain explicitly, so escalations stop bouncing between teams and the spreadsheet archaeology finally goes away.
Specs & Requirements
| Monitors | IBM Power Systems via the HMC — managed systems, LPARs (AIX, IBM i, Linux on Power), and VIOS |
| HMC | REST API enabled with PCM aggregation on. Verified against HMC V10 R3 SP1063 |
| Exporter host | Linux x86_64 (RHEL 9.x verified). Statically-linked binary, no runtime dependencies — runs on glibc and musl distributions alike |
| Connectivity | TCP 12443 from the exporter host to each HMC |
| Network | One TCP port (default 9876) for Prometheus scraping |
| Prometheus | Prometheus 2.x or 3.x (OpenMetrics compatible) |
| Grafana | 9.x – 12.x (three dashboards included: overview, per-system, per-LPAR) |
| Service | Hardened systemd unit and dedicated service account installed by install.sh |
Deploy in 5 minutes
You run it on one central host, with no agent on your partitions. First, download the tarball, extract it, and run the installer — it creates the service account, places the binary, and installs the systemd unit and an environment template (and it preserves any existing credentials). Then set your HMC connection details and enable the service.
# 1. Extract and install
tar xzf power-hmc-exporter-v0.9.0-linux-amd64.tar.gz
cd power-hmc-exporter-v0.9.0-linux-amd64/
sudo ./install.sh

# 2. Set HMC host / user / password
sudo vi /etc/sysconfig/power-hmc-exporter

# 3. Enable and start the service
sudo systemctl enable --now power-hmc-exporter
journalctl -u power-hmc-exporter -f
Finally, add the scrape target to prometheus.yml and import the three dashboards under grafana/ via Dashboards → Import.
Configuration options
| Variable | Description |
|---|---|
PHMC_HMC_HOST |
HMC hostname or IP (required) |
PHMC_HMC_USER |
HMC user, typically hscroot (required) |
PHMC_HMC_PASSWORD / PHMC_HMC_PASSWORD_FILE |
HMC password, inline or from a file (the file form is preferred) |
PHMC_HMC_PORT |
HMC REST API port (default 12443) |
PHMC_INSECURE_SKIP_VERIFY |
Skip TLS verification for self-signed HMC certificates (default false) |
PHMC_LISTEN_ADDR |
Exporter HTTP listen address (default :9876) |
PHMC_POLL_INTERVAL |
Interval between HMC poll cycles (default 60s) |
PHMC_REQUEST_TIMEOUT |
Per-API-call timeout (default 30s) |
PHMC_MAX_CONCURRENCY |
Max concurrent HMC requests per cycle (default 6; lower to 1 for sequential) |
Licensing
Two ways to subscribe, both annual and billed via Stripe: per LPAR — €45 / LPAR / year, set the quantity to the number of LPARs you monitor — or a flat per-HMC plan at €600 / HMC / year covering unlimited LPARs behind that HMC (the better deal for dense estates). Pick the option right on this page. Updates and support are always included; cancel anytime and your monitoring runs to the end of the paid term. For 500+ LPAR estates, contact us about enterprise agreements. You can also try it first with a fully-functional 30-day free trial. For licensing inquiries, contact legal@aixwatch.com.
Frequently Asked Questions
What does this give me that an in-LPAR exporter doesn’t?
The virtualization layer. An OS-level exporter sees CPU, memory and disks inside one partition. power-hmc-exporter, however, sees the shared processor and memory pools, the VIOS serving each LPAR, and the SEA / NPIV / VSCSI mappings between them — the relationships that an in-LPAR agent simply cannot see, and that otherwise live only in lsmap / lshwres output.
Do I have to install anything on my LPARs?
No. power-hmc-exporter runs centrally and polls the HMC REST API, so your AIX, IBM i and Linux-on-Power partitions stay untouched — one exporter covers every LPAR on every managed system, and you deploy nothing on the partitions themselves. We price the license per managed system (Power server), not per LPAR.
How does it know which VIOS serves which LPAR?
It resolves the relationships from the PCM data and stamps them onto the metrics as labels — the primary SEA VIOS for each per-LPAR network series (which self-corrects on a SEA failover), the VIOS behind each NPIV physical port, and the vhost serving each VSCSI disk. So you filter and group by VIOS, SEA or FC port directly, with no id→name join.
Deployment & compatibility
Which HMC versions are supported?
We verify it against HMC V10 R3 SP1063, with the REST API enabled and PCM aggregation turned on for the managed systems of interest. It calls the V10 nested ManagedSystem/LogicalPartition PCM endpoints.
How fresh is the data?
The HMC PCM facility has an intrinsic processing latency of roughly 6–7 minutes on V10 — and that is the console, not the exporter. The exporter exposes power_hmc_system_pcm_sample_age_seconds, so you can alert on staleness; we recommend a 15-minute threshold.
Can it monitor more than one HMC?
Yes. Run one exporter instance per HMC and scrape them all into the same Prometheus; the Grafana dashboards then aggregate across managed systems with a Managed System selector.
Where do the Fibre Channel error metrics come from?
HMC PCM does not expose FC port error counters. Therefore those panels read aix_fcstat_* from a separate AIX_exporter that you scrape into the same Prometheus, joined on the AIX partition name. Where no AIX_exporter runs, the panels simply show No data, and the rest of the dashboard keeps working.
Does it run on any Linux distribution?
Yes. We link the binary statically with no external dependencies, and we have verified it on Ubuntu, Debian, RHEL/AlmaLinux, Fedora, Arch and Alpine (musl). RHEL 9.x is the reference platform.
What does the free trial include?
Everything. The 30-day trial runs the complete metric set and all three dashboards, so you can evaluate it against your own estate before you purchase a per-managed-system license.
Additional information
| Licensing | Per LPAR, Per HMC (flat) |
|---|