AIX-exporter
60 € / yearNative Prometheus exporter for IBM AIX – 22 collectors, 600+ metrics covering CPU, memory, disk, FC, network, NFS, errpt and more. Requires only gcc-libs, BFF packaged, SRC integrated. Grafana dashboard included.
Native monitoring tools for IBM AIX systems
Showing all 4 results
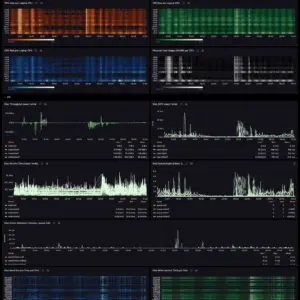
Native Prometheus exporter for IBM AIX – 22 collectors, 600+ metrics covering CPU, memory, disk, FC, network, NFS, errpt and more. Requires only gcc-libs, BFF packaged, SRC integrated. Grafana dashboard included.
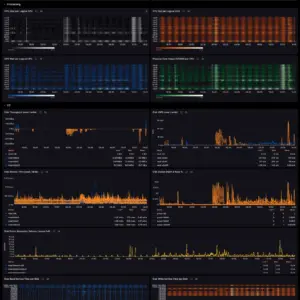
AIX-exporter + Loki Agent + power-hmc-exporter — the complete AIX monitoring stack on one annual subscription. Volume tiers from €120 down to €60/LPAR/yr. Grafana dashboards included.
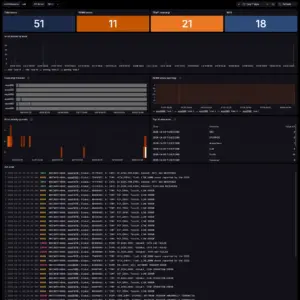
Native AIX error log forwarder for Grafana Loki – real-time errpt monitoring with 9 structured labels. Requires only gcc-libs, TLS support, BFF packaged. Centralize AIX error logs across your fleet.
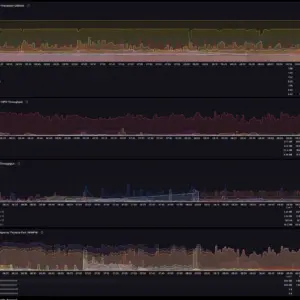
Map your entire PowerVM virtualization layer from the HMC: shared CPU & memory pools, LPAR↔VIOS relationships, and SEA / NPIV / VSCSI attribution — as Prometheus metrics with cross-reference labels pre-resolved. Agentless, three dashboards included. Annual subscription — per LPAR, or a flat per-HMC plan.