AIX Monitoring
AIXwatch Suite
AIX-exporter + Loki Agent + power-hmc-exporter — the complete AIX monitoring stack on one annual subscription. Volume tiers from €120 down to €60/LPAR/yr. Grafana dashboards included.
The Complete AIX Monitoring Software Suite — Metrics, Logs & the PowerVM Layer
AIXwatch is complete AIX monitoring software for IBM Power Systems — metrics, logs, and the PowerVM layer in one suite. The AIXwatch Suite brings together all three AIXwatch products — AIX-exporter, Loki Agent for AIX and power-hmc-exporter — on one annual subscription, priced per LPAR. Performance metrics from libperfstat, errpt streams in Loki, and the whole PowerVM virtualization layer from the HMC: everything from the hardware frame down to the errpt line, unified in your Grafana stack.
Three layers
Every layer of your AIX estate, one subscription
Most monitoring stops at the operating system. The Suite covers three layers at once: OS metrics and OS logs from a lightweight agent on each LPAR, plus the entire virtualization layer read agentlessly from the HMC. One subscription, one renewal, one Grafana.
Correlation
Spot what a single signal can’t tell you
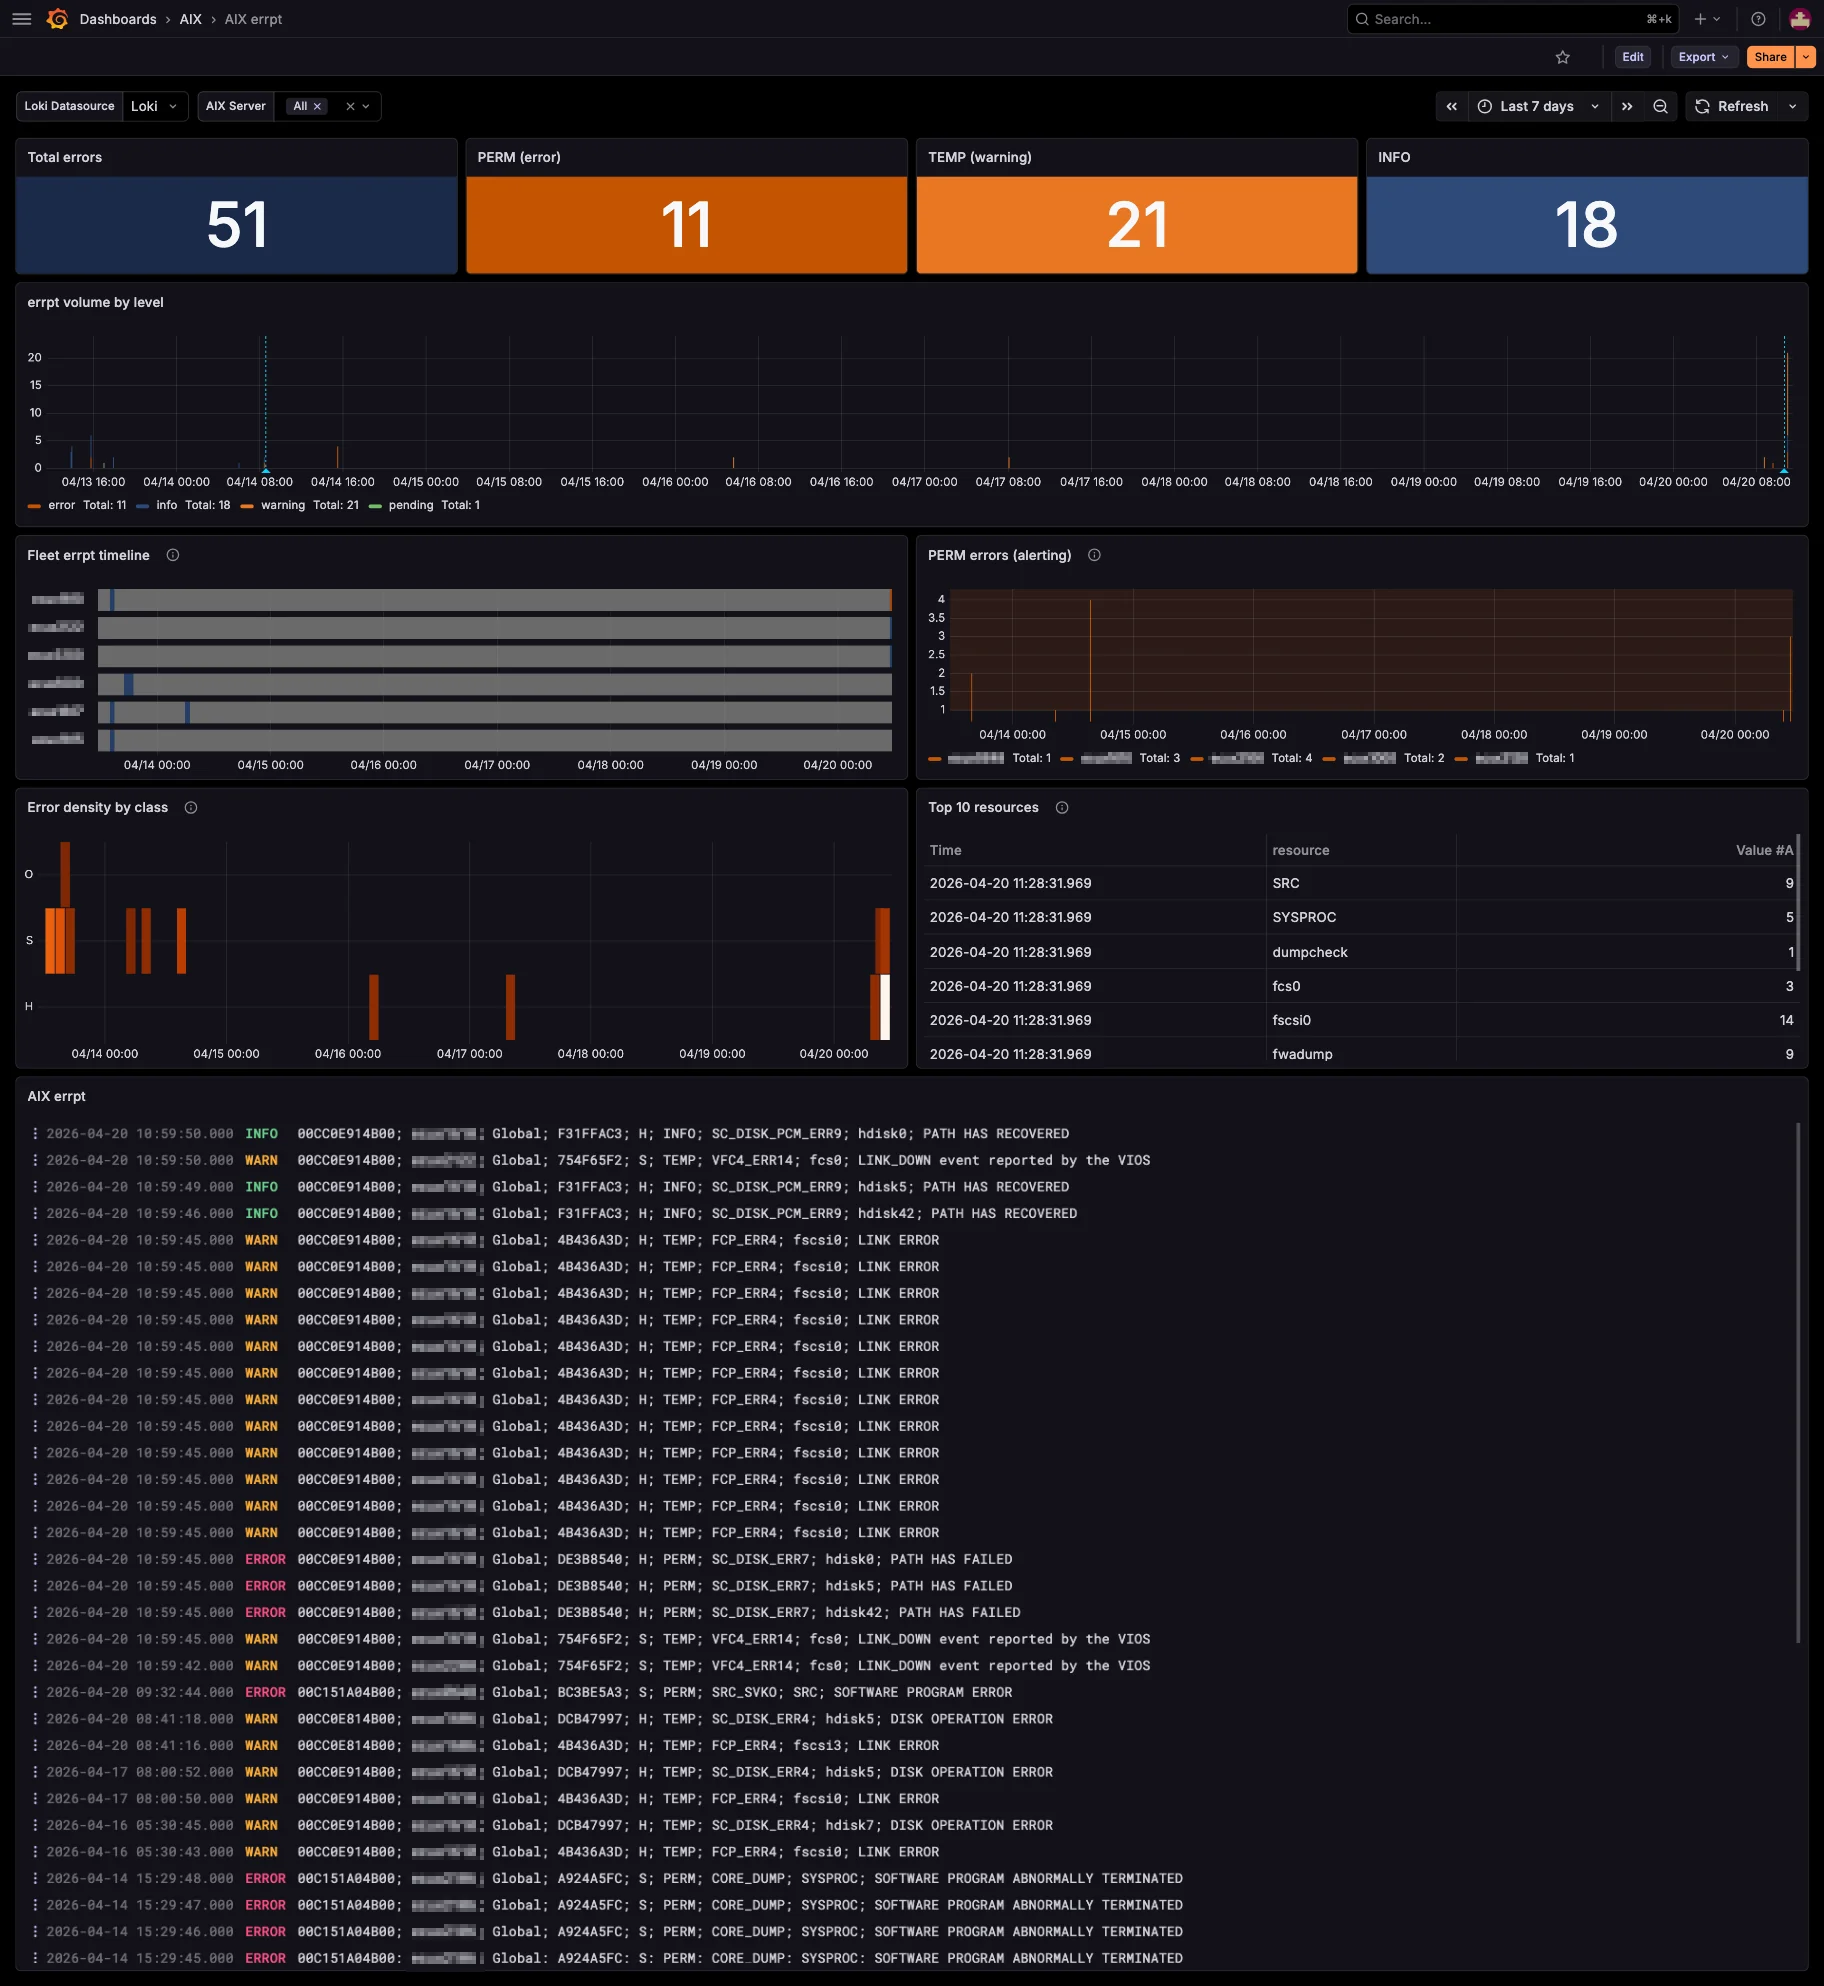
Open one Grafana dashboard. CPU wait spikes at 02:47 on lpar-prod-01. Drop to the Loki panel below — the errpt entry that triggered it is right there, same timestamp. Jump to the PowerVM view — the VIOS Fibre Channel port serving that LPAR is throwing link errors. Three layers, one timeline, root cause in seconds instead of an afternoon of grepping across hosts.
FCP_ERR4 (LINK ERROR) (Loki Agent)Right tool, right place
Agents where you need them, agentless where it counts
AIX-exporter and Loki Agent install as native installp packages on each LPAR — SRC subsystems, auto-start on boot, under 8 MB combined. power-hmc-exporter is different by design: it runs on a single central host and polls the HMC, so you install nothing on your partitions to map the whole virtualization layer.
# on each LPAR
# installp -aXcd /tmp/aix-exporter.bff aix-exporter.rte
SUCCESS: aix-exporter.rte
# installp -aXYgd /tmp/loki-agent.bff all
SUCCESS: loki-agent

# once, on a central host — nothing on the LPARs
# systemctl enable --now power-hmc-exporter
0513-059 power-hmc-exporter active — polling HMC

# metrics :9100 · logs → Loki · PowerVM ← HMC
Deploy once
Roll out across the fleet
The two OS agents deploy with one Ansible playbook across every LPAR — same BFF format, same SRC patterns, same config style. The PowerVM collector is a single service you stand up once. Same DevOps muscle memory, no duplicate processes to maintain across the estate.
---
# the two OS agents, fleet-wide
- hosts: aix_fleet
  tasks:
    - name: Install AIX-exporter BFF
      shell: installp -aXcd {{ pkg }}/aix-exporter.bff aix-exporter.rte
    - name: Install Loki Agent BFF
      shell: installp -aXYgd {{ pkg }}/loki-agent.bff all
    - name: Start both subsystems
      shell: startsrc -s {{ item }}
      loop: [ aix-exporter, loki-agent ]

# the PowerVM collector, once
- hosts: hmc_collector
  tasks:
    - name: Enable power-hmc-exporter
      systemd: { name: power-hmc-exporter, enabled: yes, state: started }
What’s in the Suite
OS metrics
AIX-exporter
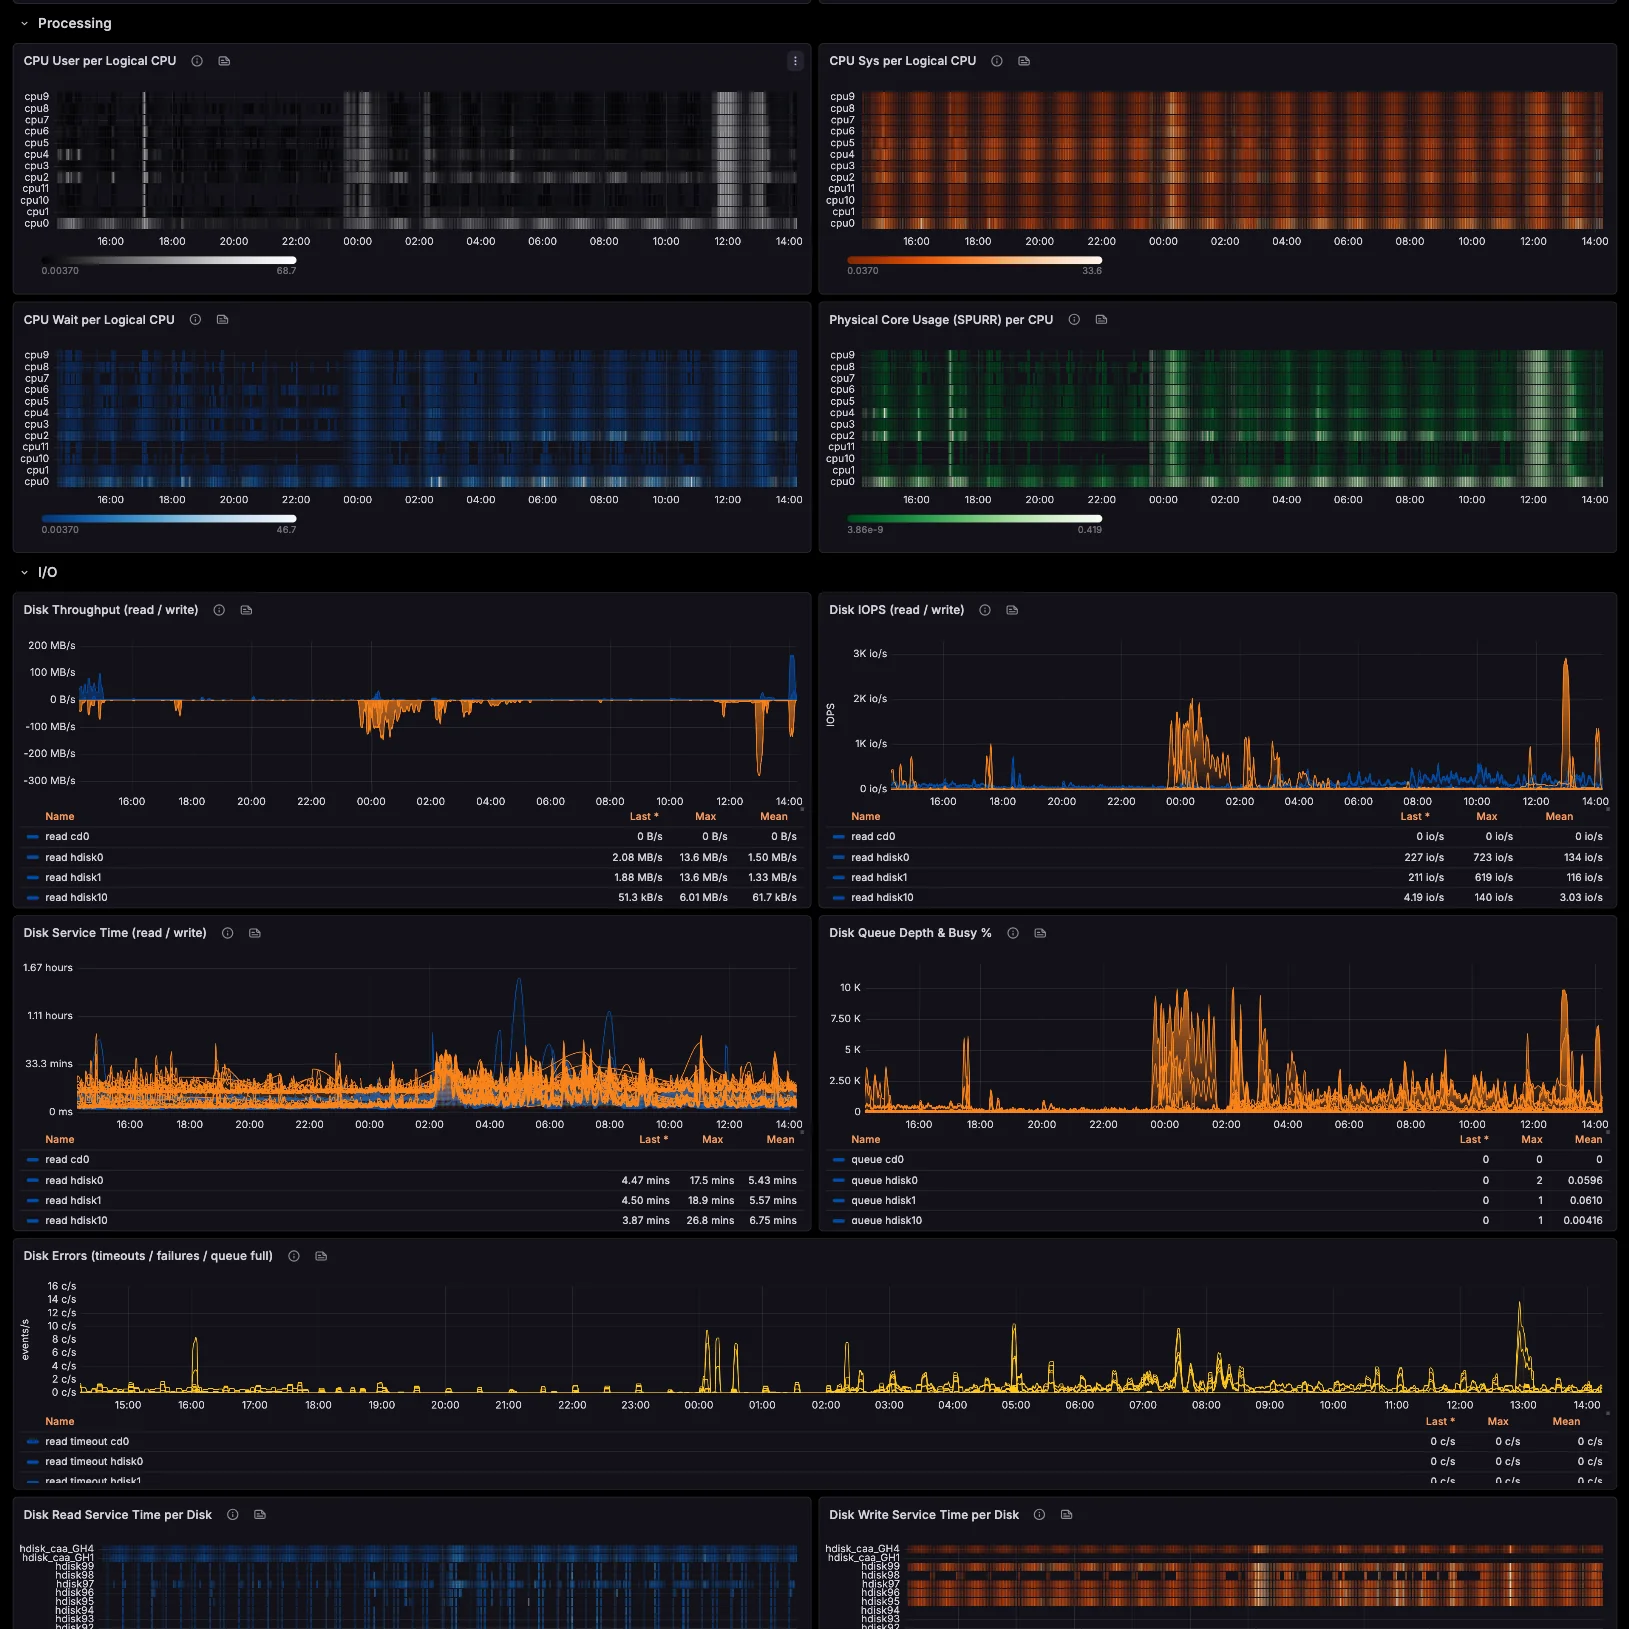
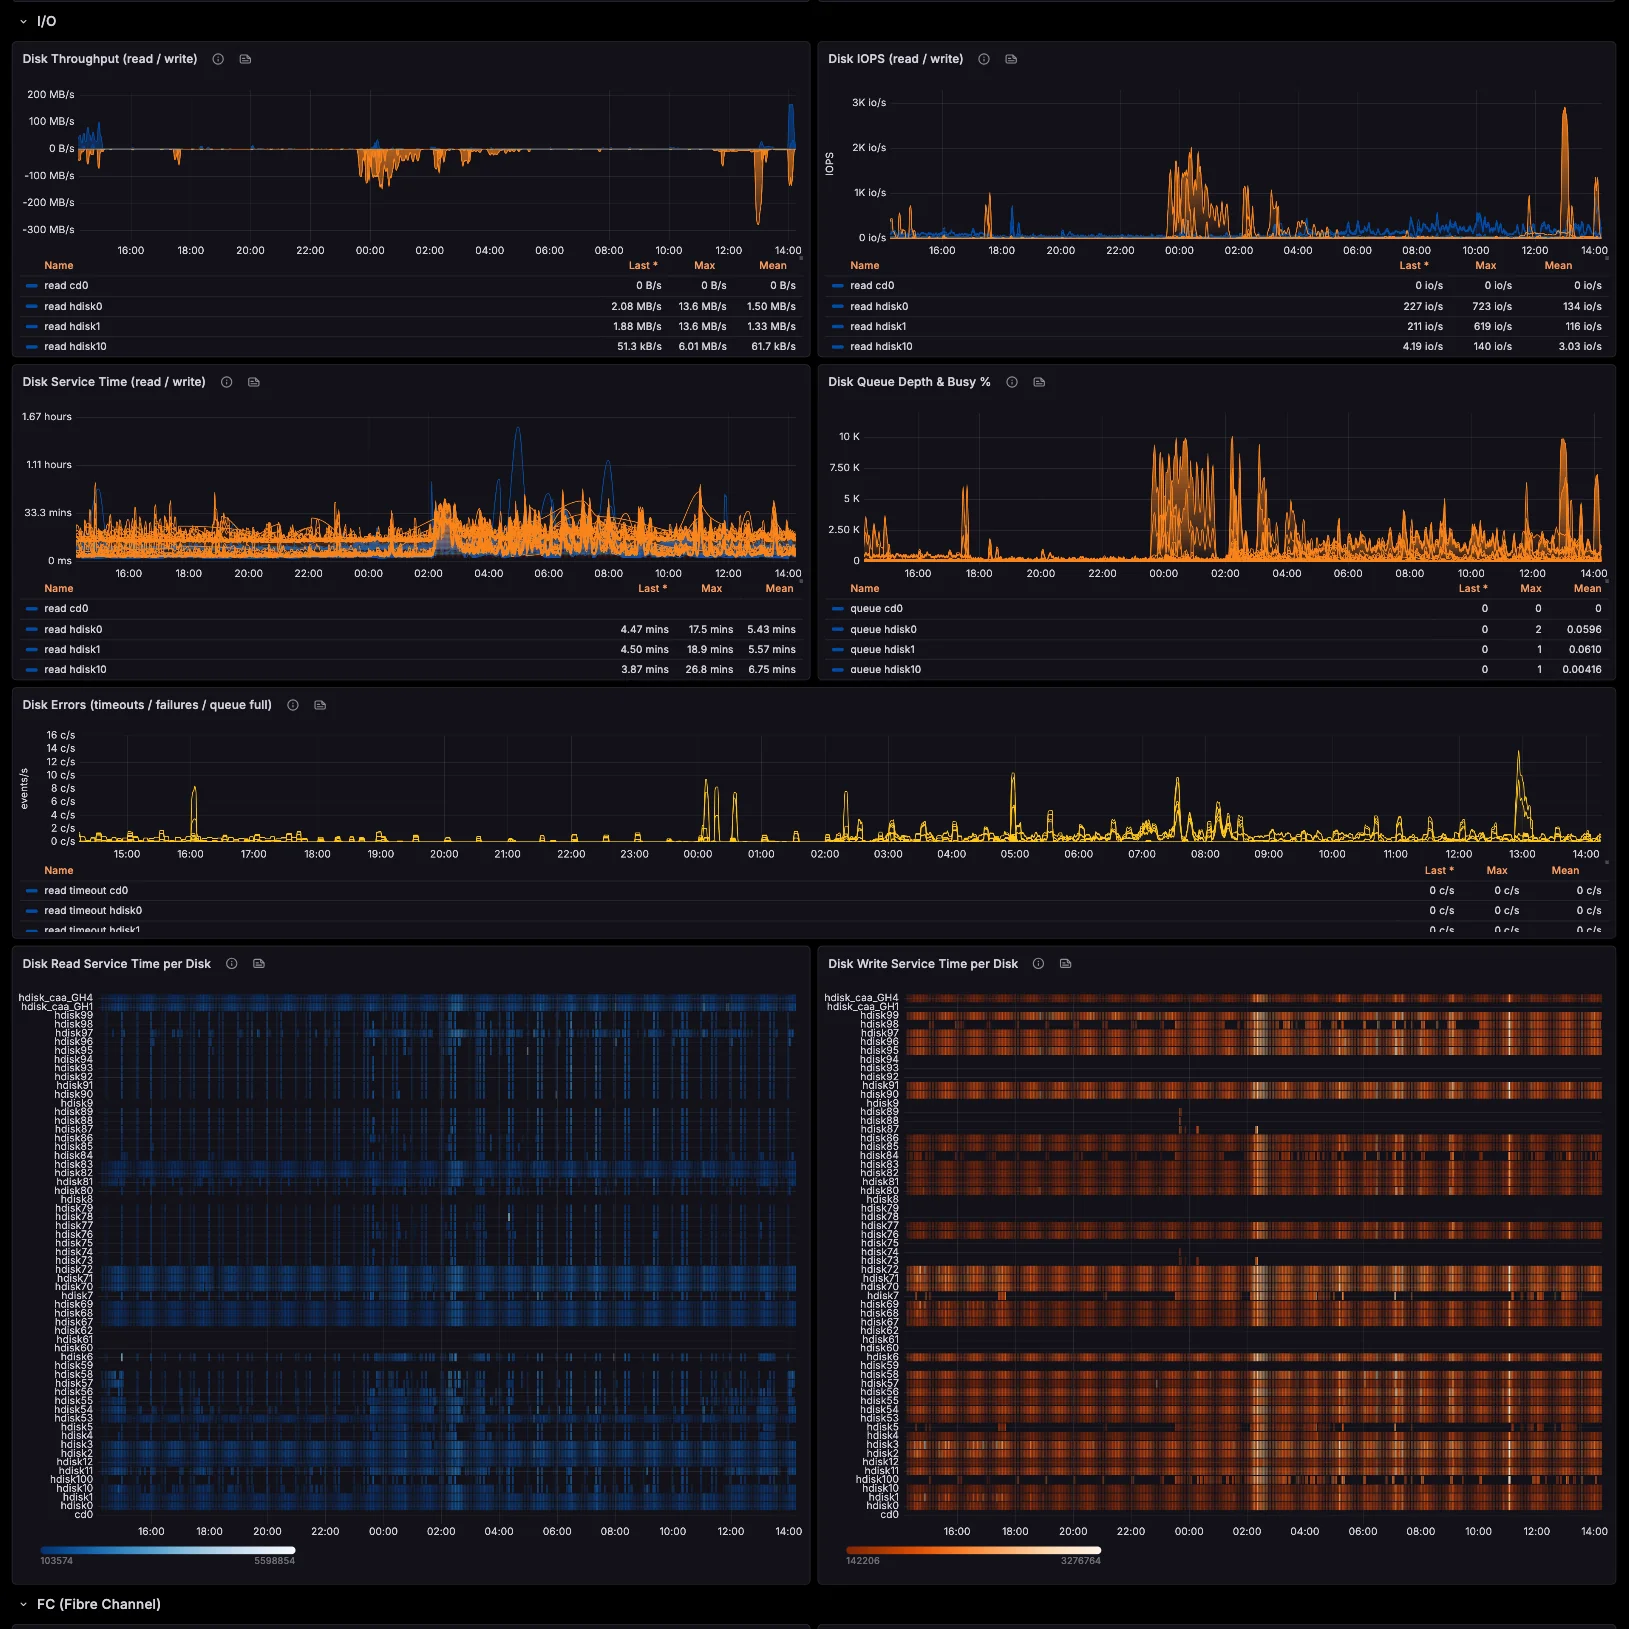
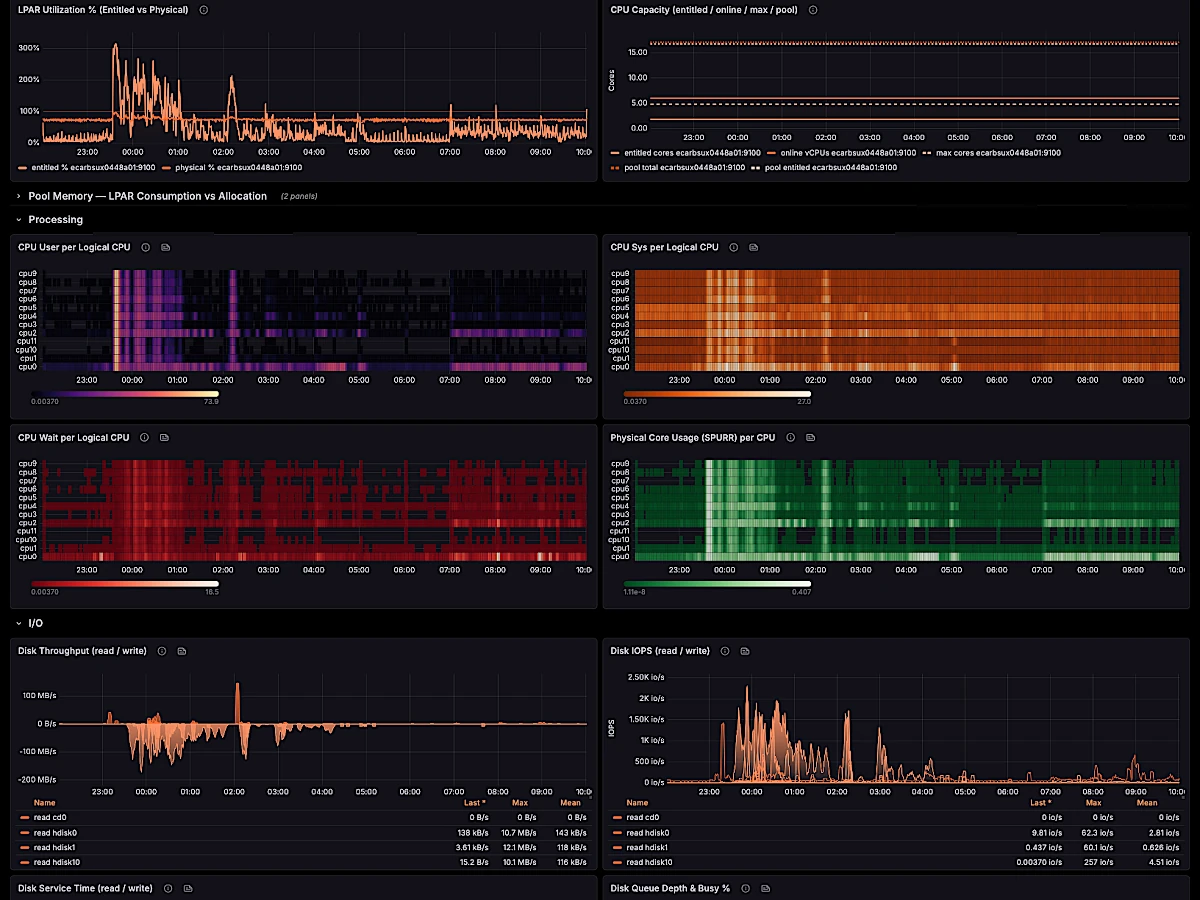
22 native collectors, 137 metrics, 600+ time series per LPAR. Single C binary on libperfstat, OpenMetrics-compatible, ships with a 60-panel Grafana dashboard.
OS logs
Loki Agent for AIX
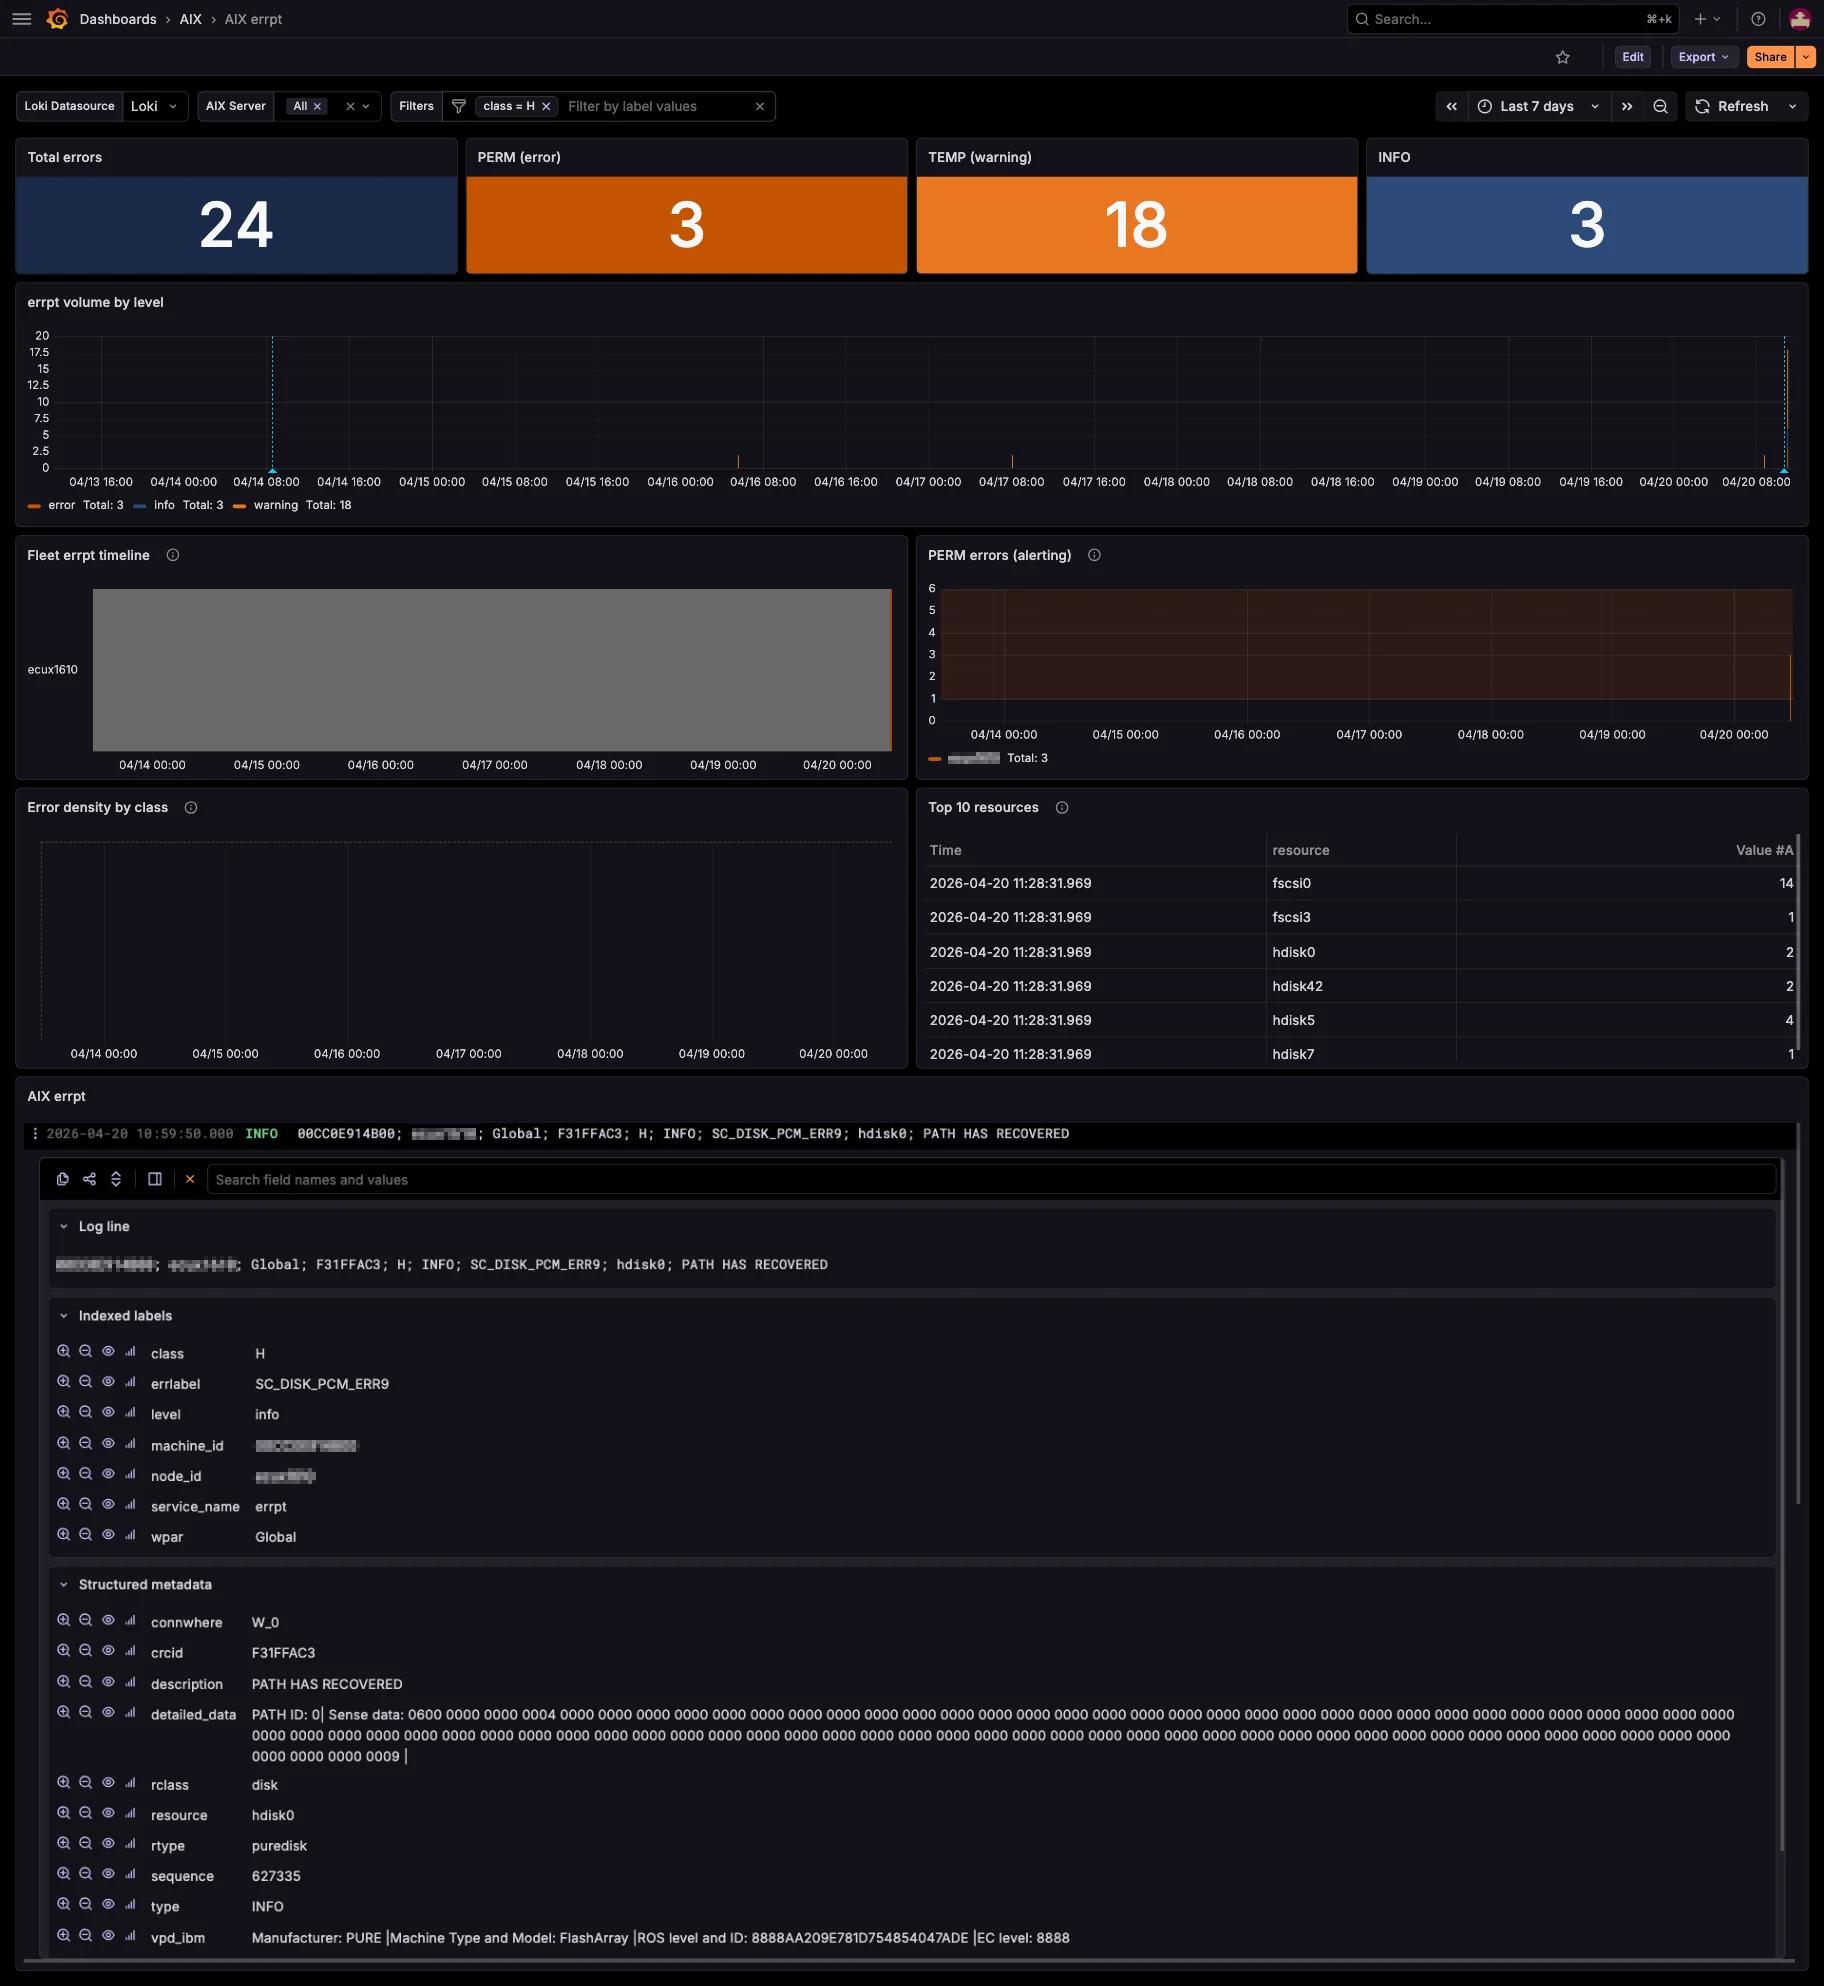
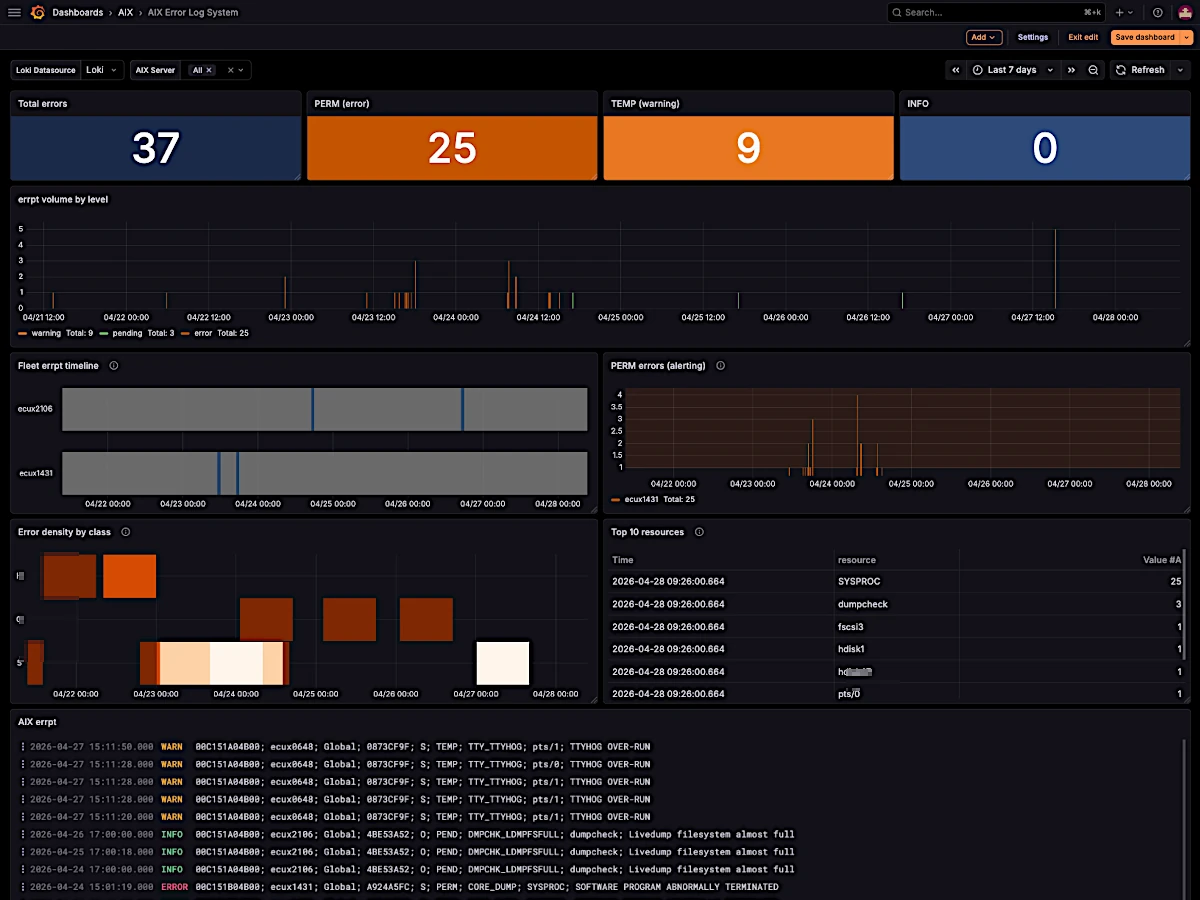
Real-time errpt forwarding to Grafana Loki with structured labels (hostname, machine_id, class, type, resource). LogQL queries, multi-channel alerting, optional TLS.
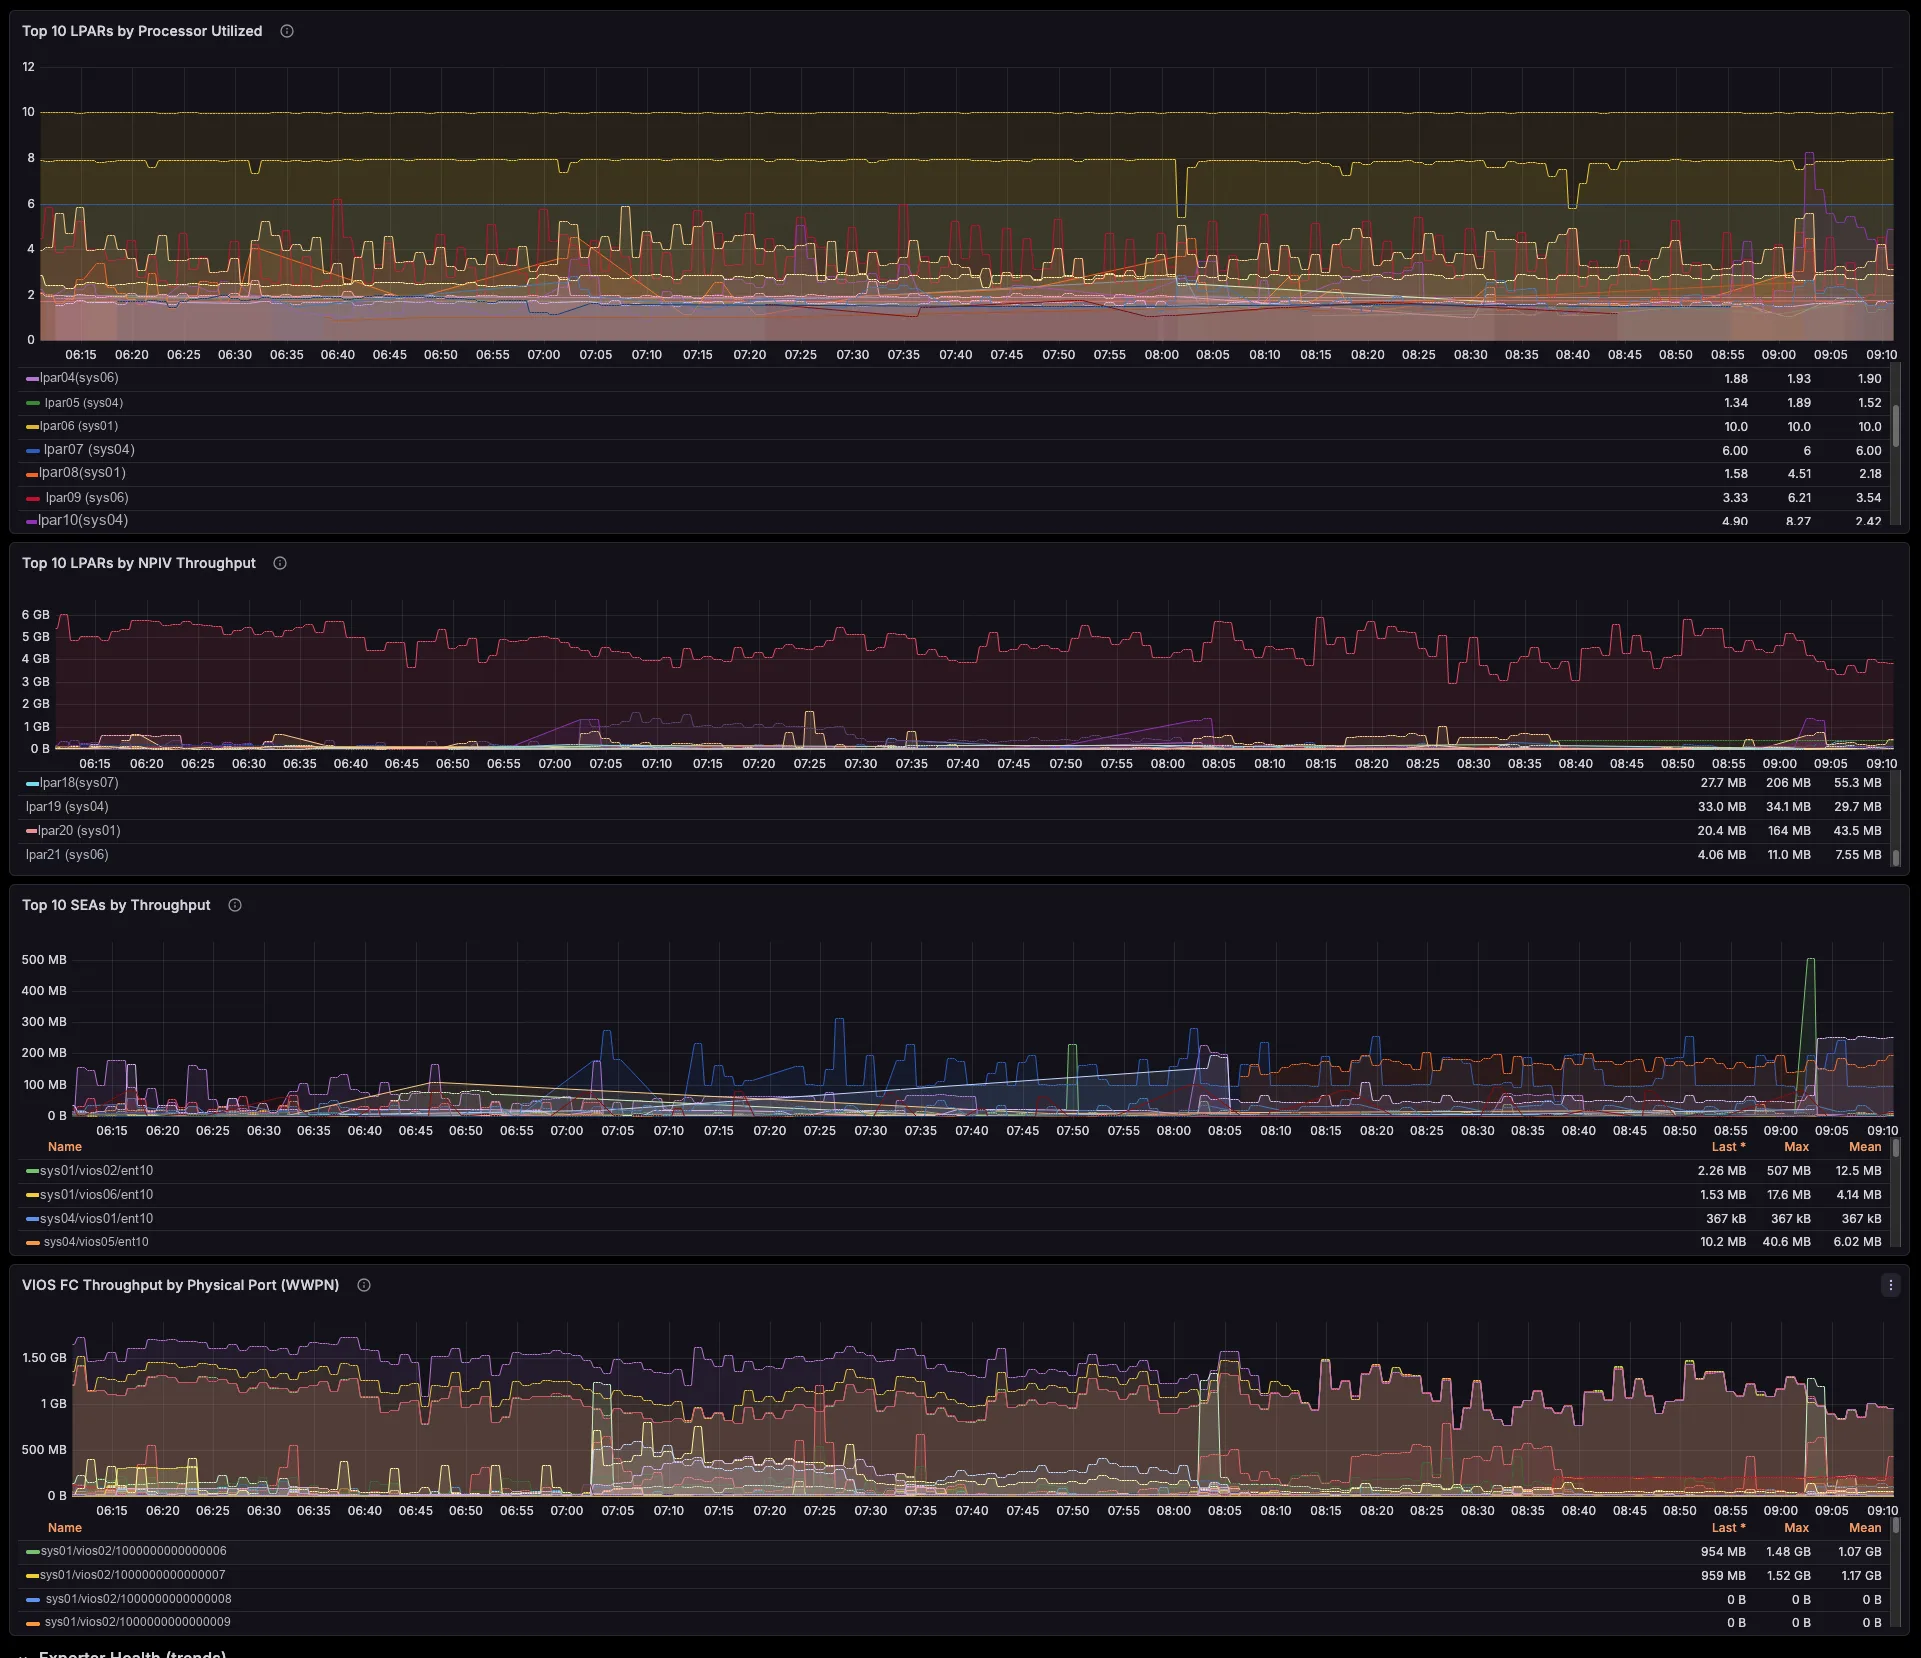
PowerVM layer
power-hmc-exporter
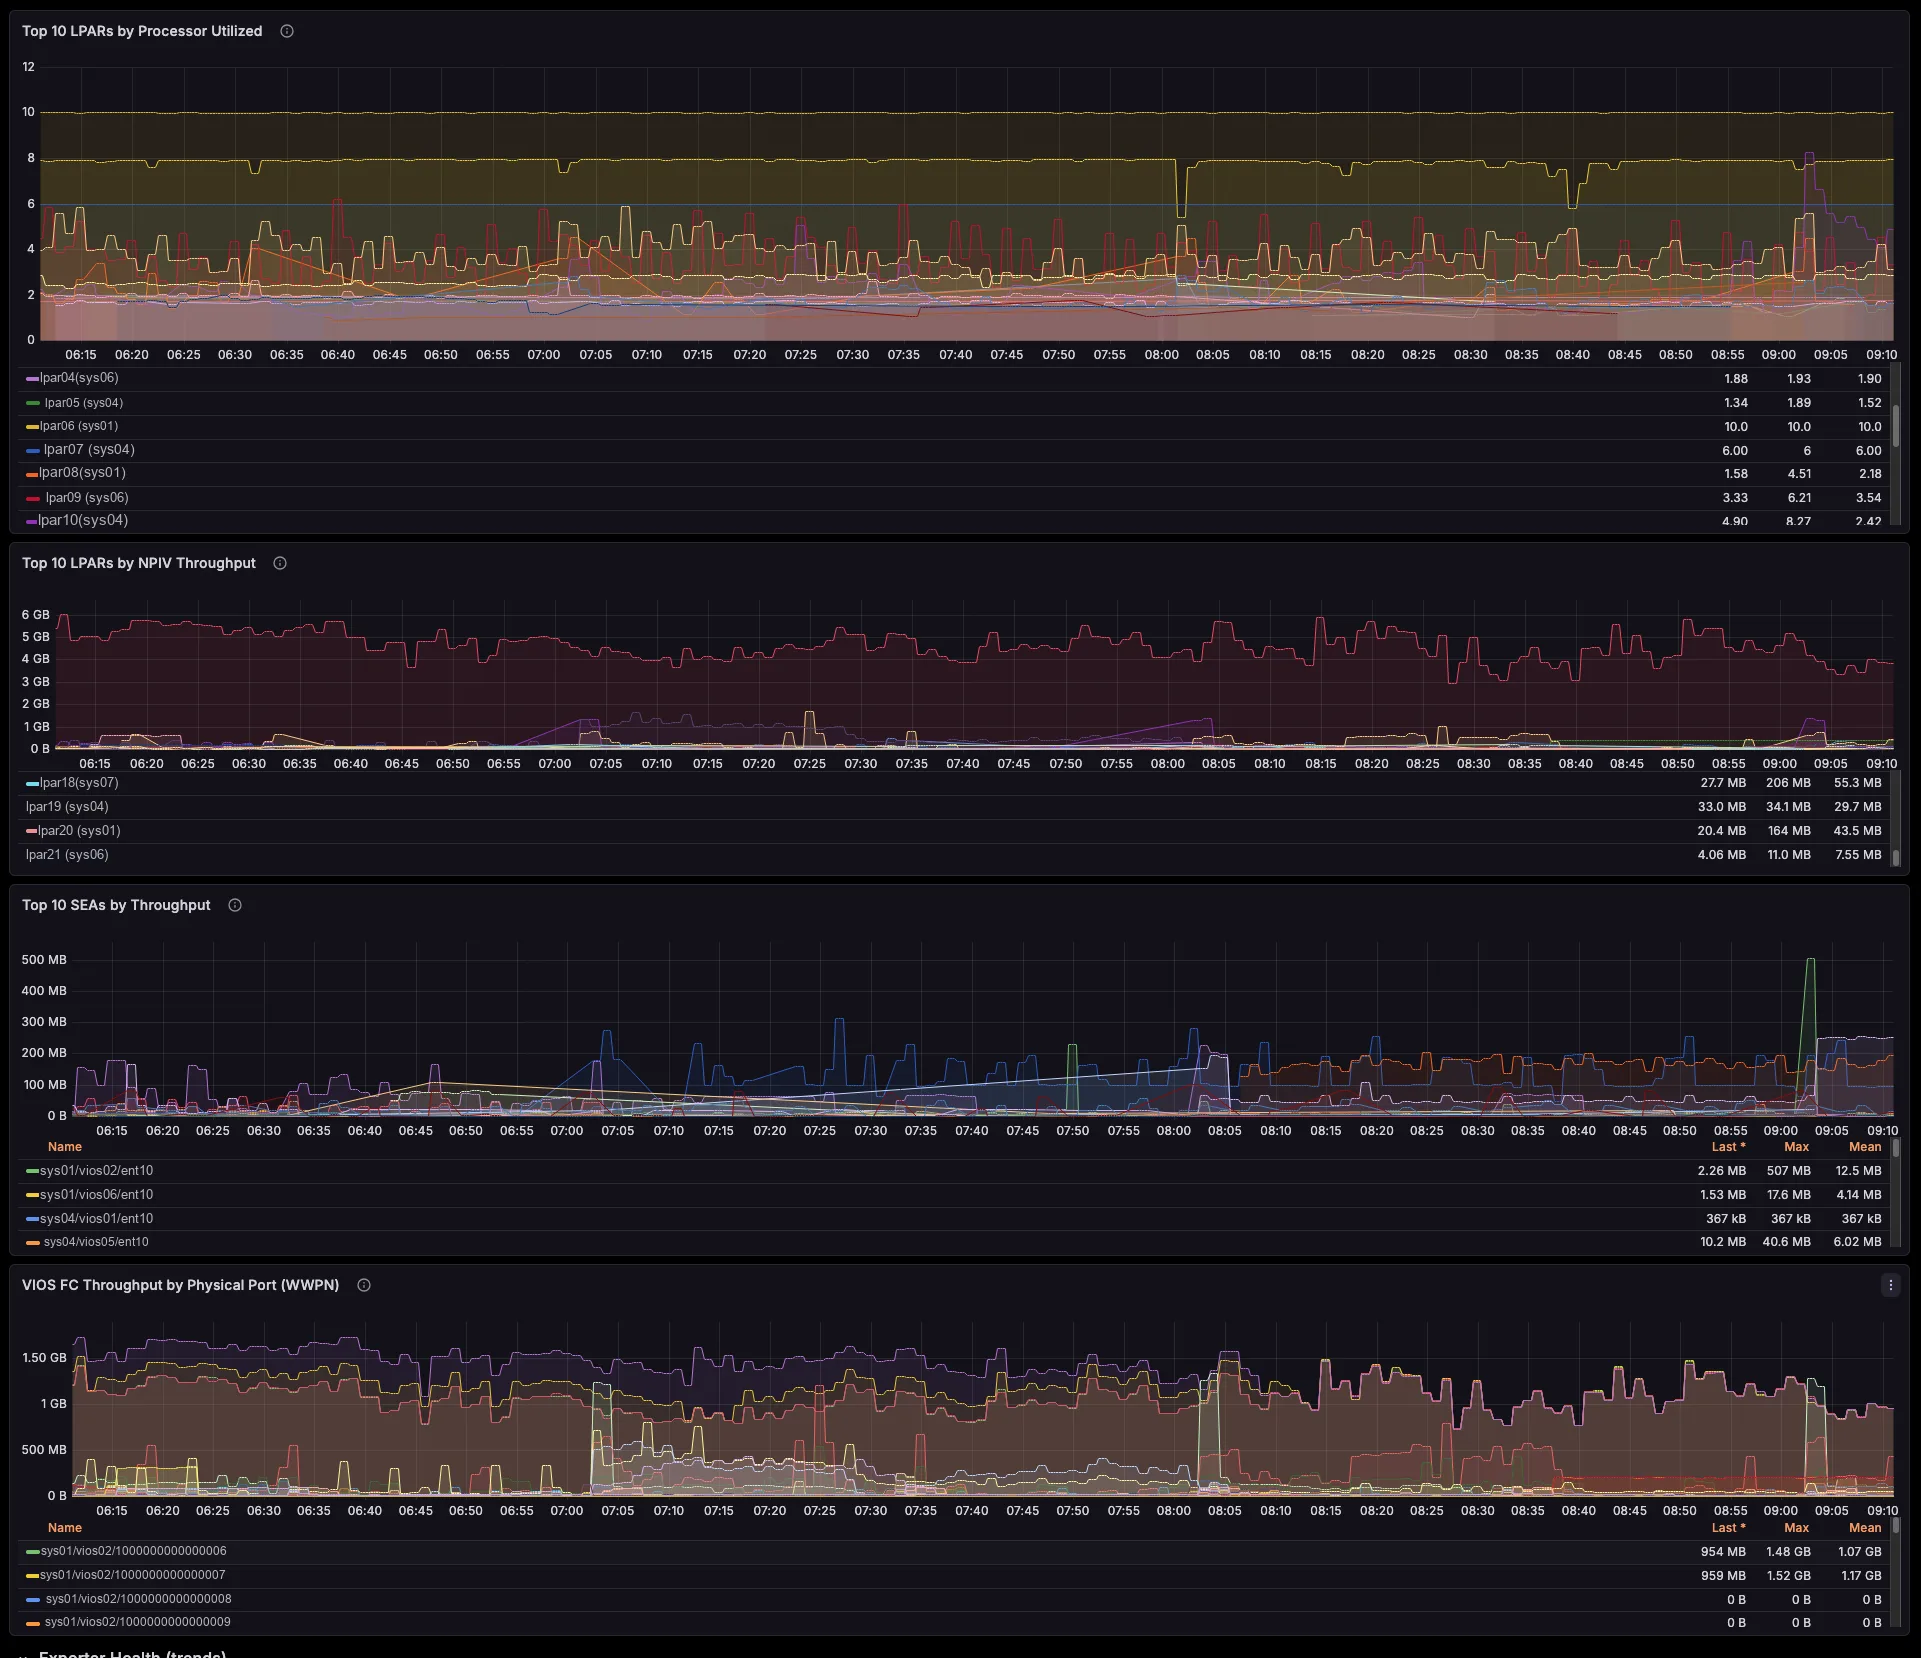
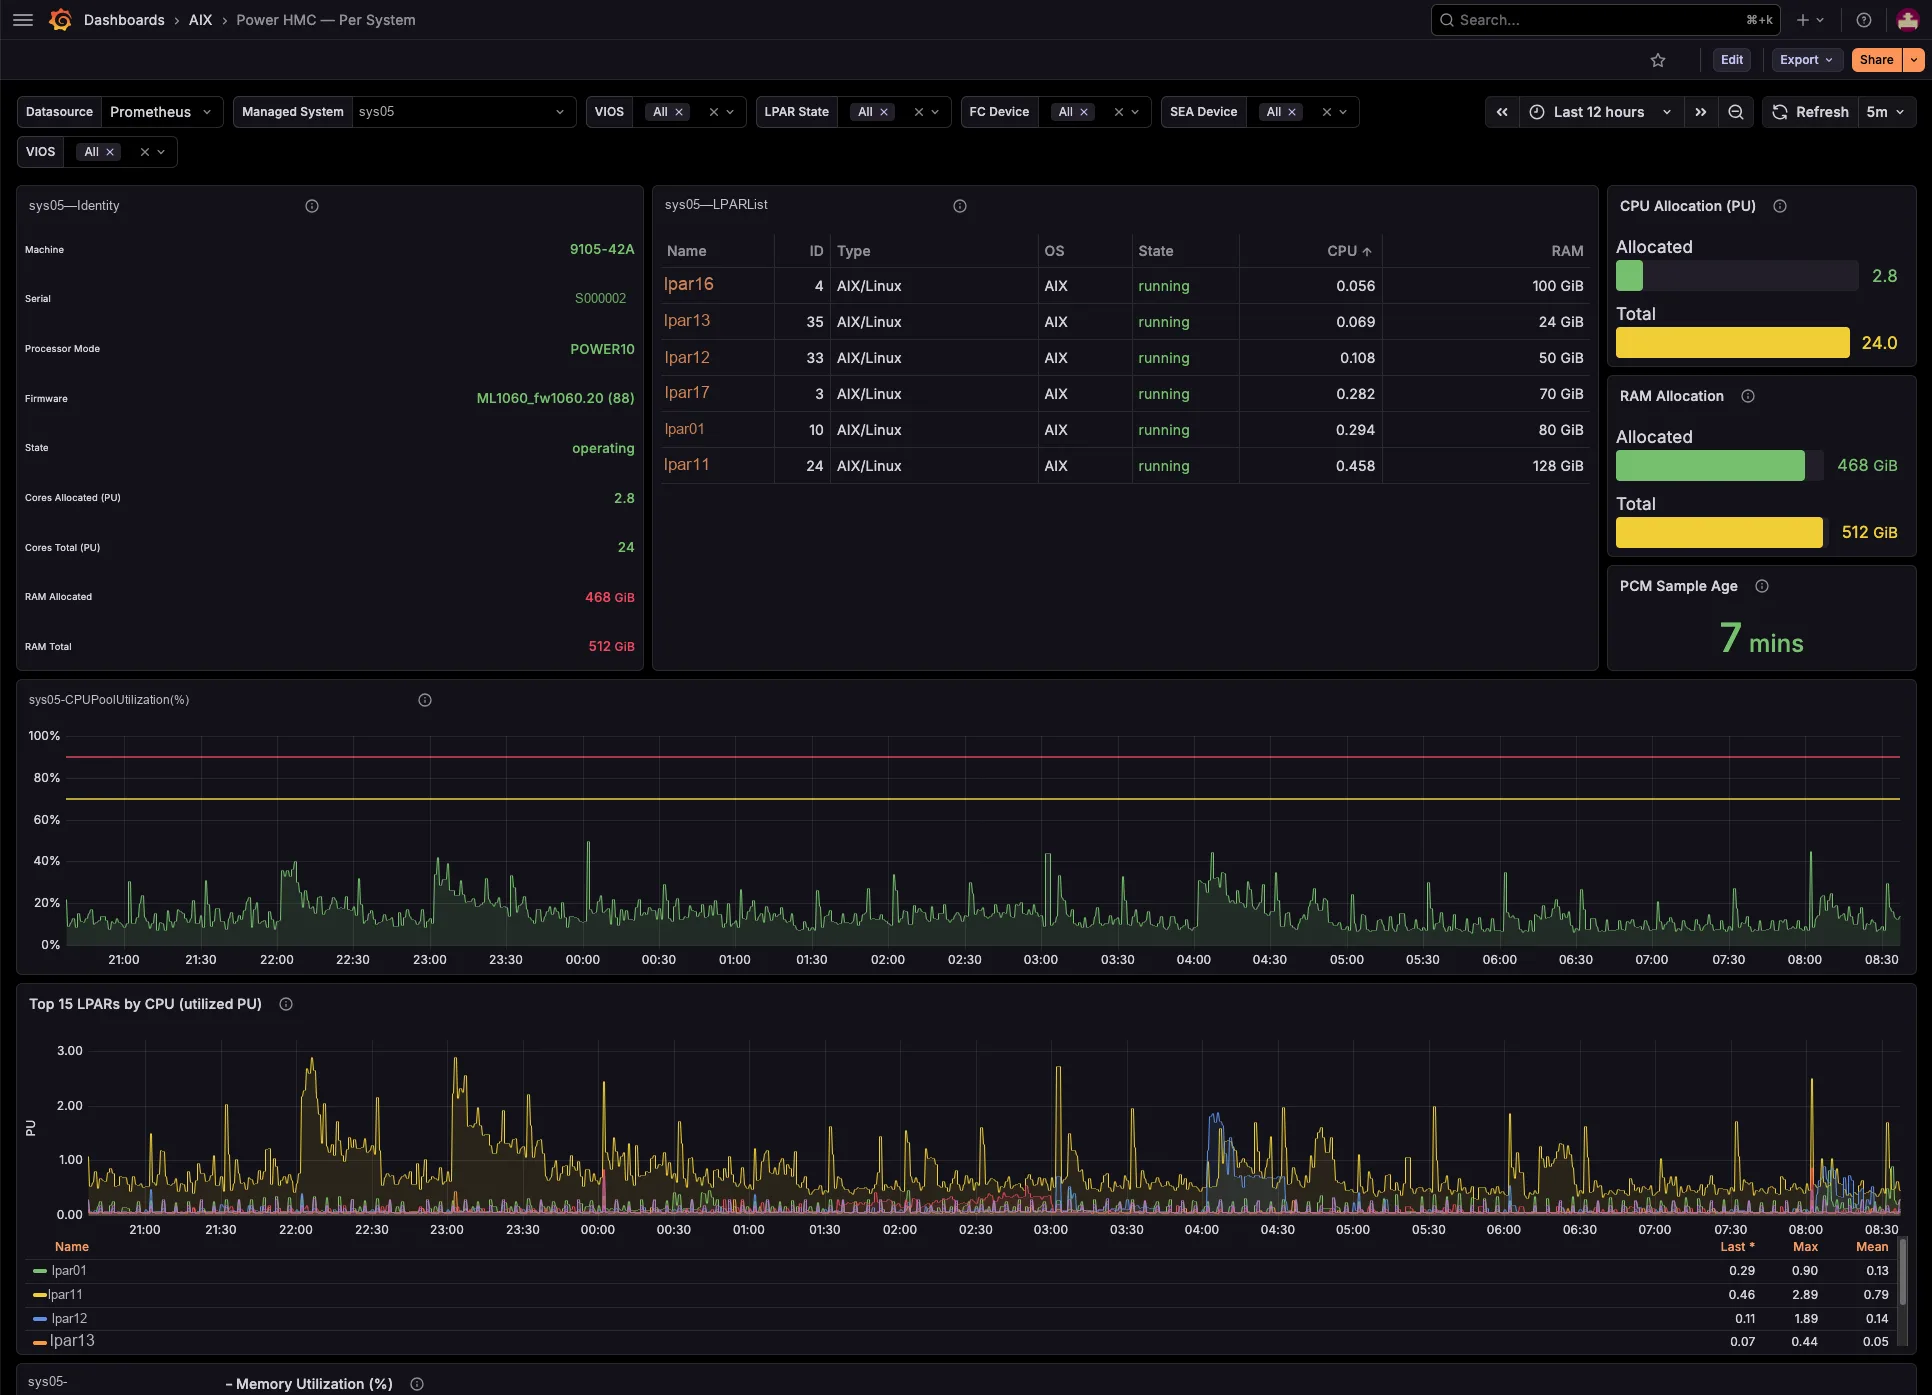
Maps shared pools, LPAR↔VIOS relationships and SEA / NPIV / VSCSI attribution as Prometheus metrics — agentless, straight from the HMC, cross-reference labels pre-resolved. Three dashboards included.
How the Suite fits together
Each LPAR runs the two lightweight OS agents: AIX-exporter exposes metrics on a Prometheus endpoint, Loki Agent pushes errpt to Grafana Loki. Alongside them, one central power-hmc-exporter polls the HMC and exposes the virtualization layer as Prometheus metrics too. Prometheus scrapes both exporters, Loki stores the logs, and all three land in the same Grafana — so a single dashboard spans OS performance, OS events and the PowerVM topology underneath them.
Use Cases
Incident replay, all three layers
Reconstruct any outage from the metric trajectory, the errpt cascade and the virtualization events — side by side, one exact timeline.
Noisy-neighbour diagnosis
A shared processor pool or VIOS adapter saturates and drags LPARs down. power-hmc pinpoints the culprit; AIX-exporter confirms the impact inside the guest.
Root cause in seconds
Performance in metrics, hardware fault in errpt, the failing FC port or SEA in the PowerVM layer — one pane of glass, shared timestamps.
Capacity & chargeback
Long-term CPU/memory/disk trends per LPAR, plus pool entitlement and shared-adapter usage from the HMC — right-size with evidence and charge back fairly.
Suite Pricing
One per-LPAR subscription covering all three layers. Volume tiers apply automatically at checkout — the more LPARs you run, the less you pay per LPAR.
| LPARs | À la carte* | Suite | You save |
|---|---|---|---|
| 1 – 30 | €145 / LPAR / yr | €120 / LPAR / yr | €25 · 17% |
| 31 – 100 | €145 / LPAR / yr | €100 / LPAR / yr | €45 · 31% |
| 101 – 500 | €145 / LPAR / yr | €80 / LPAR / yr | €65 · 45% |
| 501+ | €145 / LPAR / yr | €60 / LPAR / yr | €85 · 59% |
*À la carte = AIX-exporter €60 + Loki Agent €40 + power-hmc-exporter €45, per LPAR / year. Prices exclude VAT. USD (fixed): Suite $130 / $110 / $90 / $65 per LPAR / year. Beyond 500 LPARs, contact us for an enterprise agreement.
What’s included
- AIX-exporter BFF package (full subscription, 22 collectors, 60-panel dashboard)
- Loki Agent for AIX BFF package (full subscription, standard build — TLS variant available on request)
- power-hmc-exporter (central binary + three ready-to-import Grafana dashboards)
- All Grafana dashboard JSON files for the three products
- Ansible playbook for fleet-wide deployment of the two OS agents
- Documentation, installation guides, integration examples
- Updates and email support for all three products — always included, for the life of your subscription
Specs & Requirements
| Operating System | OS agents: IBM AIX 7.1, 7.2, 7.3 · power-hmc-exporter runs on a central Linux x86-64 or AIX host |
| Architecture | IBM Power Systems (POWER7 and later) |
| Footprint | < 8 MB RSS per LPAR for both agents (5 MB exporter + 3 MB agent), < 1% CPU each · power-hmc-exporter: one lightweight central process |
| HMC | HMC v9 or later with Performance & Capacity Monitoring (PCM) enabled · network access to the HMC REST API |
| Network | Prometheus scrape ports (9100 for AIX-exporter, exporter port for power-hmc), outbound HTTP/HTTPS to Loki |
| Backends | Prometheus 2.x or 3.x · Grafana Loki 2.x or 3.x |
| Grafana | 9.x, 10.x, 11.x, 12.x |
Deploy on AIX in minutes
The two OS agents follow the same pattern — BFF package, SRC subsystem, auto-start on boot. The PowerVM collector is stood up once on a central host. Validate on one LPAR, then roll out the agents to the fleet with the included Ansible playbook.
# 1. On each LPAR — the two OS agents
installp -aXcd /path/to/aix-exporter.bff aix-exporter.rte
installp -aXYgd /path/to/loki-agent.bff all
startsrc -s aix-exporter
startsrc -s loki-agent

# 2. Once, on a central host — the PowerVM layer (agentless)
tar xzf power-hmc-exporter-*.tar.gz && sudo ./install.sh
sudo vi /etc/sysconfig/power-hmc-exporter   # HMC host / user / password
sudo systemctl enable --now power-hmc-exporter

# 3. Verify the endpoints
curl http://localhost:9100/metrics | head        # AIX-exporter
{service_name="errpt"} | json                     # Loki, in Grafana Explore
Add both Prometheus targets to your prometheus.yml, point Loki Agent at your Loki instance, and import the Grafana dashboard JSONs for all three products. Done.
Licensing
One annual subscription for the whole Suite — AIX-exporter, Loki Agent and power-hmc-exporter together — billed per LPAR through Stripe. From €120 per LPAR per year with volume tiers built in (€100 at 31+, €80 at 101+, €60 at 501+ LPARs). Updates and support are always included; cancel anytime and your monitoring runs to the end of the paid term. TLS variant of Loki Agent available on request after subscribing.
Frequently Asked Questions
Can I subscribe to just one product instead of the Suite?
Yes. AIX-exporter (€60), Loki Agent (€40) and power-hmc-exporter (€45 per LPAR, or a flat per-HMC plan) are each available on their own. The Suite simply bundles all three at a lower per-LPAR rate, from €120 down to €60 with volume tiers.
How is power-hmc-exporter counted inside the Suite?
The Suite is a single per-LPAR subscription that covers all three layers for every LPAR you run — including the PowerVM visibility that power-hmc-exporter provides. Set the quantity to the number of LPARs you monitor. (Bought standalone, power-hmc-exporter also offers a flat per-HMC plan for very dense estates.)
Do I need Prometheus AND Loki?
Yes — Prometheus stores time-series metrics (from AIX-exporter and power-hmc-exporter), Loki stores log streams (from Loki Agent). They run alongside each other and all feed Grafana. If you already have a Prometheus stack, adding Loki is straightforward; if you have neither, the included documentation walks you through both.
What’s the resource overhead on my LPARs?
Under 8 MB RSS combined (5 MB exporter + 3 MB agent) and well under 2% CPU on a typical LPAR for the two OS agents — single-threaded C binaries reading kernel interfaces, no JVM, no container runtime. The PowerVM layer adds nothing on the LPARs: power-hmc-exporter runs centrally and polls the HMC.
Can I deploy with Ansible?
Yes — a unified Ansible playbook installs and configures the two OS agents fleet-wide in one pass, with pre-flight checks and post-install verification. The central power-hmc-exporter is a single service you enable once.
Is there a trial?
Free trials are available for each product individually. Combine them to evaluate the full Suite on your own infrastructure before subscribing — no time limit.
Related products
-
-
-
power-hmc-exporter
From: 45 € / LPAR / yearSelect options This product has multiple variants. The options may be chosen on the product page